This post Bubble Poponomics appeared first on Daily Reckoning.
In the 1990s, Cisco was the hottest stock in the world. It gained a remarkable 89,000% throughout the decade.
Cisco shares peaked in March of 2000 at a $550 billion market cap. That year the company made a $2.7 billion profit. That would give CSCO a P/E ratio of around 200x at its peak.

The prices investors were willing to pay for tech growth brought the entire stock market to bubbilicious levels. It was a classic market mania.
Fast-forward to today, and we are trading near, or even above, those 2000 levels.
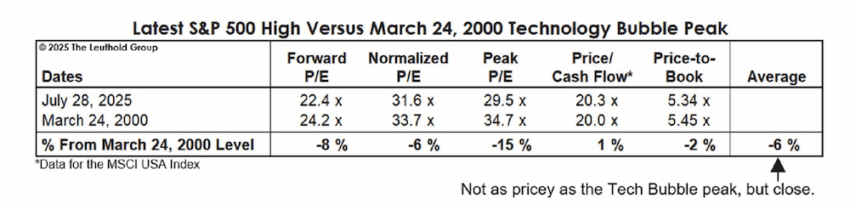
Below is a simple comparison table of the S&P 500’s valuation in March 2000 and today.

Source: Leuthold Group via Meb Faber
According to this research, the S&P 500 is about 6% less overvalued today vs. 2000 levels.
However, according to other measures, we’re in record territory. Below is a chart showing the Nasdaq market cap compared to U.S. M2 money supply. We’ve surpassed the 2000 record, despite incredible growth in U.S. money supply due to the COVID money-printing spree.
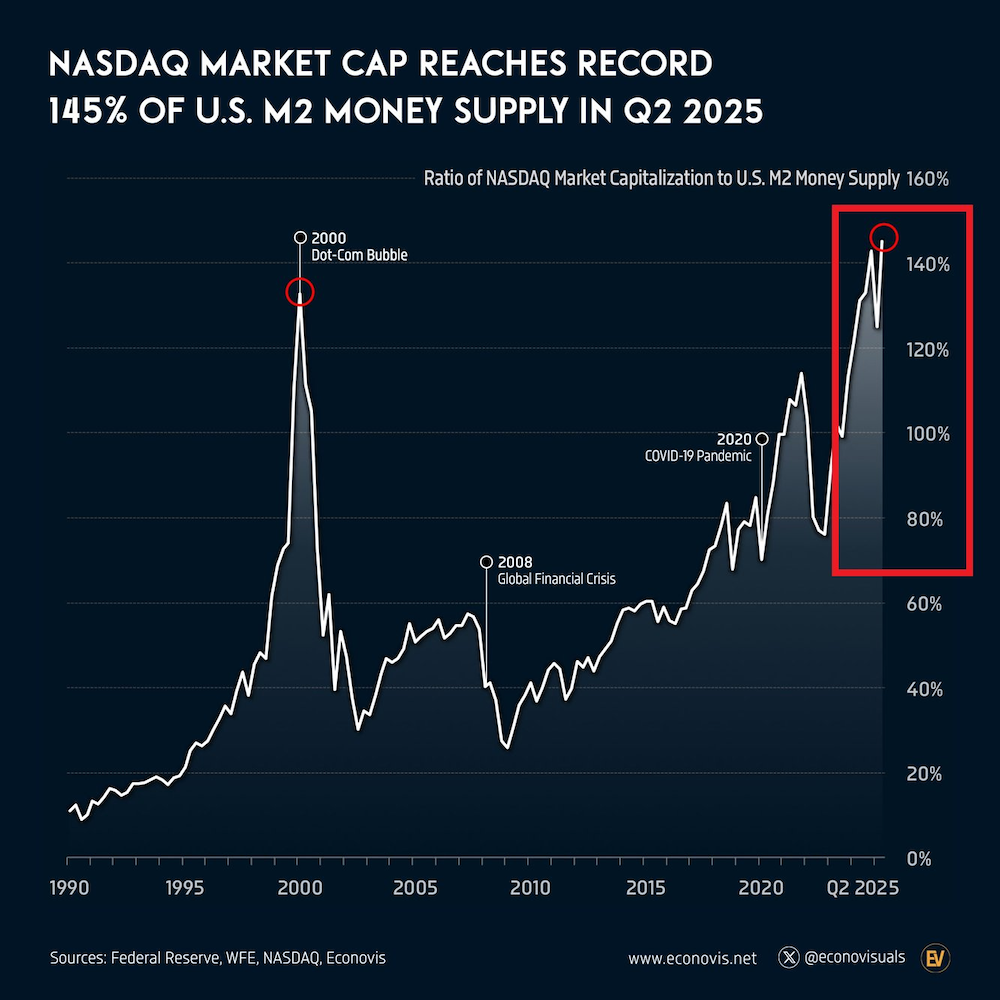

Source: Econovisuals on X
Money supply has soared, but stocks have soared even more.
And according to another classic valuation metric, the Buffett Indicator, we’re in uncharted waters. The Buffett Indicator, if you’re not familiar, is Warren Buffett’s favorite way to measure how overvalued the market is. It simply measures the size of the stock market compared to the economy as measured by GDP.
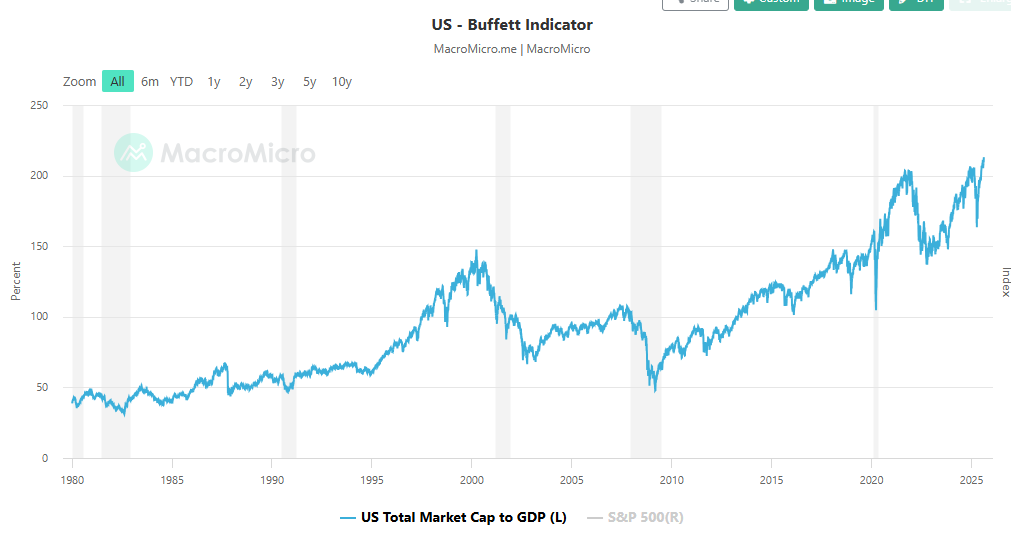
Source: MacroMicro
In 2000 the Buffett Indicator peaked around 150%. Today it’s well over 200%. Before the tech bubble began in the late 1990s, it floated around 50-60% for decades.
After the 2000 bubble popped , the tech-heavy Nasdaq fell 78%.
The Nasdaq index would take 15 years to surpass its previous highs. And that’s without factoring in inflation or opportunity cost.
Cisco, to this day, has still not surpassed its 2000 peak. In terms of market cap, today it’s worth $275B, compared with its $550B valuation in March of 2000.
What Worked Then Should Work Now
So, what worked after the dot-com bubble popped in 2000?
- Gold and silver + miners
- Base metal miners
- Emerging markets
- Oil and gas
Hard assets and natural resources were the key to investing success in the post dot-com period. This is the playbook I’m relying on. Sure, tech might have one last blowoff top left in it, but I’ve already moved on.
I’d rather invest at the beginning of a super-cycle rather than the tail end.
Gold, silver, and miners are already popping. They’re leading the vanguard of this inevitable rotation into hard assets.
The great news for investors is that opportunities abound. Miners with existing operations are incredibly attractive. And it’s finally possible to get permitting for new projects thanks to Trump’s regulatory reforms. Exploration, development, and production are all about to see a huge boost.
Here in America, politicians are finally realizing that we’ve fallen horribly far behind when it comes to hard assets and natural resources.
Nobody has been more right about this trend than Jim Rickards and his team. Jim came up with the American Birthright thesis and it’s playing out just as he said.
We’ll keep exploring ideas to profit from this ongoing shift. It’s an exciting time, and we believe this rotation into hard assets has only just begun.
The post Bubble Poponomics appeared first on Daily Reckoning.
Click this link for the original source of this article.
Author: Adam Sharp
This content is courtesy of, and owned and copyrighted by, https://dailyreckoning.com and its author. This content is made available by use of the public RSS feed offered by the host site and is used for educational purposes only. If you are the author or represent the host site and would like this content removed now and in the future, please contact USSANews.com using the email address in the Contact page found in the website menu.