
California, the largest EV market in the nation, has experienced a huge drop in Tesla vehicle sales. Sales plunged 21% in the second quarter of 2025 compared to the same time period in 2024. This slowdown in sales has contributed to stagnation in the EV market as a whole. Experts say the dip is likely due to multiple factors including rising prices, dwindling government incentives, and increased competition. Tesla’s market share in the west coast state has also dropped, raising valid concerns. The decline may be indicative of overall slowing momentum in the EV market space, as well as changing consumer expectations.
Electric vehicles are nothing new. Cleveland-based Baker Motor Vehicle produced an electric-powered two-seater in 1899; Thomas Edison bought one (the first car he owned) and the White House ordered some prototypes for its automobile fleet.
Electric cars were pushed off the streets by refinements in the internal combustion engine and an abundance of cheap gasoline, as well as their limited range and the paucity of recharging facilities. (These are the 13 biggest electric vehicle failures in American history.)
Times have changed, though. These days, gas costs $4-$5 a gallon in many places; there are more than 160,000 charging stations around the country; and the luxury Lucid Air, made by a company co-founded by a former Tesla VP, can run for an estimated 516 miles between plug-ins. Of course, it costs $139,650, which might encourage some car buyers to look for a vehicle with a shorter range and a lower price tag. (Here’s a list of the cheapest electric vehicles you can buy.)
One thing is certain: Electric cars are here to stay. They’re expected to account for about a third of all car and truck purchases in the U.S. by 2030. The Bipartisan Infrastructure Law, signed by President Biden in late 2021, provides $7.5 billion for new charging stations. This August, Connecticut became the first state to mandate that only zero-emission vehicles may be sold within its borders as of 2035, and at least eight other states are expected to pass similar initiatives.
To compile a list of the best cities for electric vehicles, 24/7 Wall Street reviewed a study conducted by Roof Gnome, a solar installation information company. The site drew data from 10 governmental and non-governmental sources, including Allstate, the FBI, the National Highway Traffic Safety Administration, and the U.S. Department of Energy to rank the 200 largest U.S. cities according differently weighted metrics in four categories: infrastructure (charging stations, EBV repair facilities, etc.), cost (insurance, electricity), incentives (number of tax breaks and other considerations), and safety (including number of traffic accidents and car thefts).
Only 10 states are represented in the top 40 cities on the list, with environment-conscious (and car-crazy) California landing the most places – 17 in all. That’s not surprising, but the No. 2 state might well be: It’s Texas, whose culture and economy have traditionally been built around the extraction of fossil fuels. Maybe that’s a sign that the switch to electric vehicles really is inevitable.
This post was updated on July 31, 2025 to include recent news of California’s Tesla sales.
40. Santa Clarita, California
- Infrastructure rank:137/200
- Cost rank:58/200
- Incentives rank:54/200
- Safety rank:26/200
- Overall score:44.62
39. Bakersfield, California
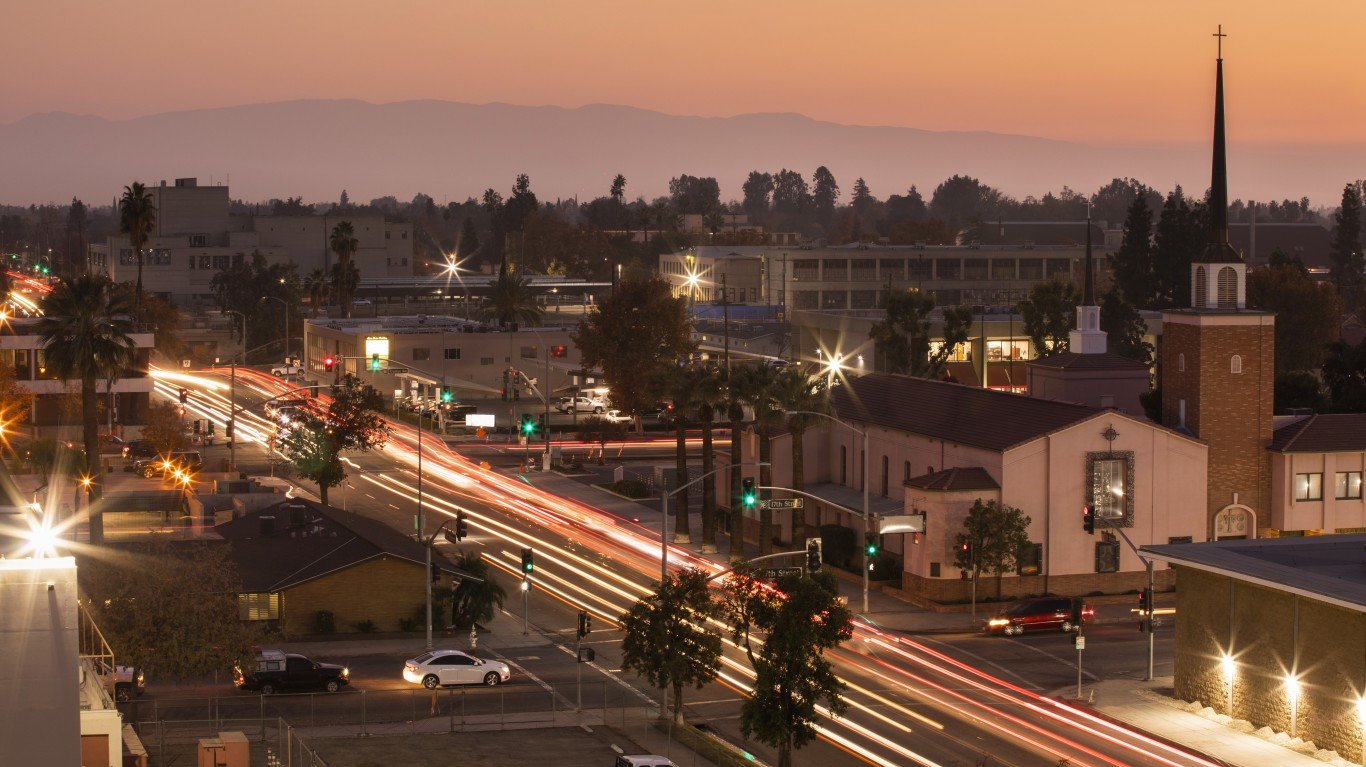
- Infrastructure rank:57/200
- Cost rank:143/200
- Incentives rank:22/200
- Safety rank:168/200
- Overall score:44.66
38. Cincinnati, Ohio

- Infrastructure rank:75/200
- Cost rank:51/200
- Incentives rank:24/200
- Safety rank:177/200
- Overall score:44.73
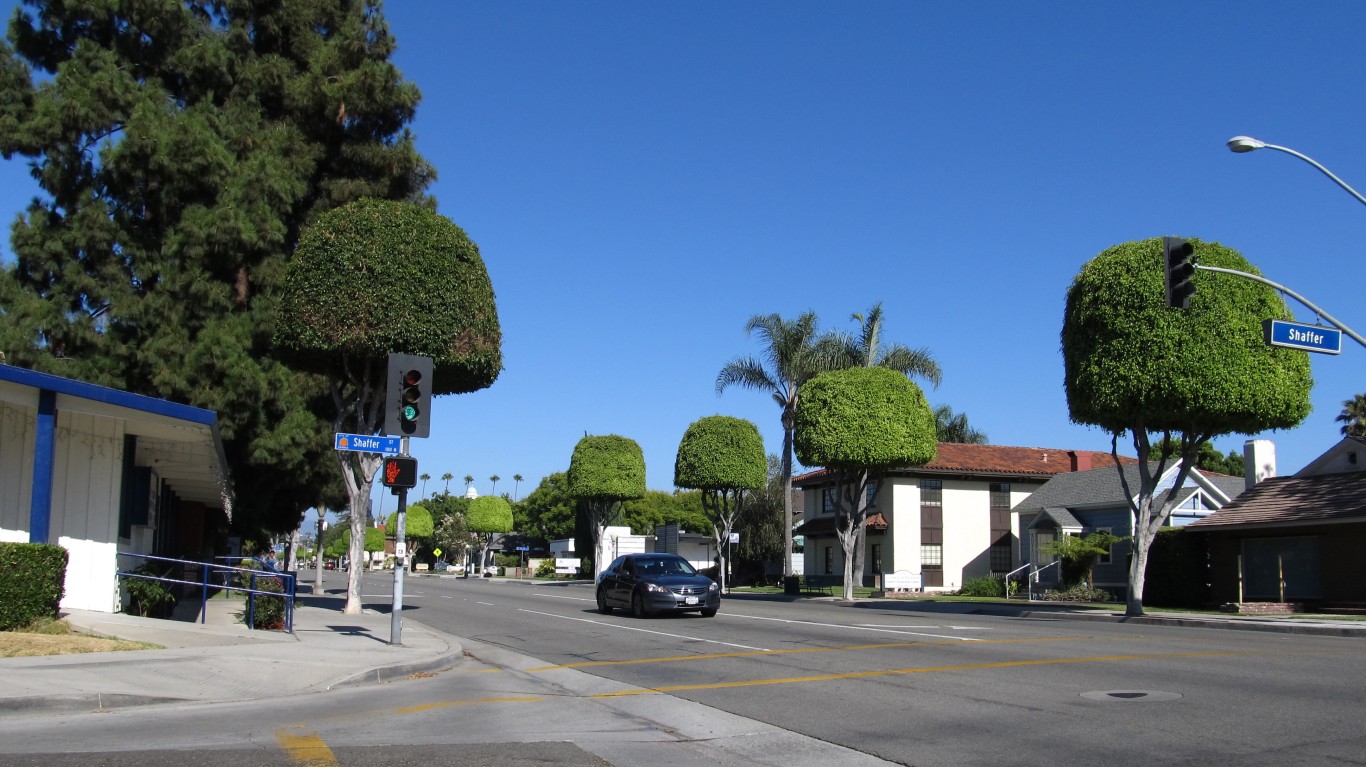
37. Torrance, California
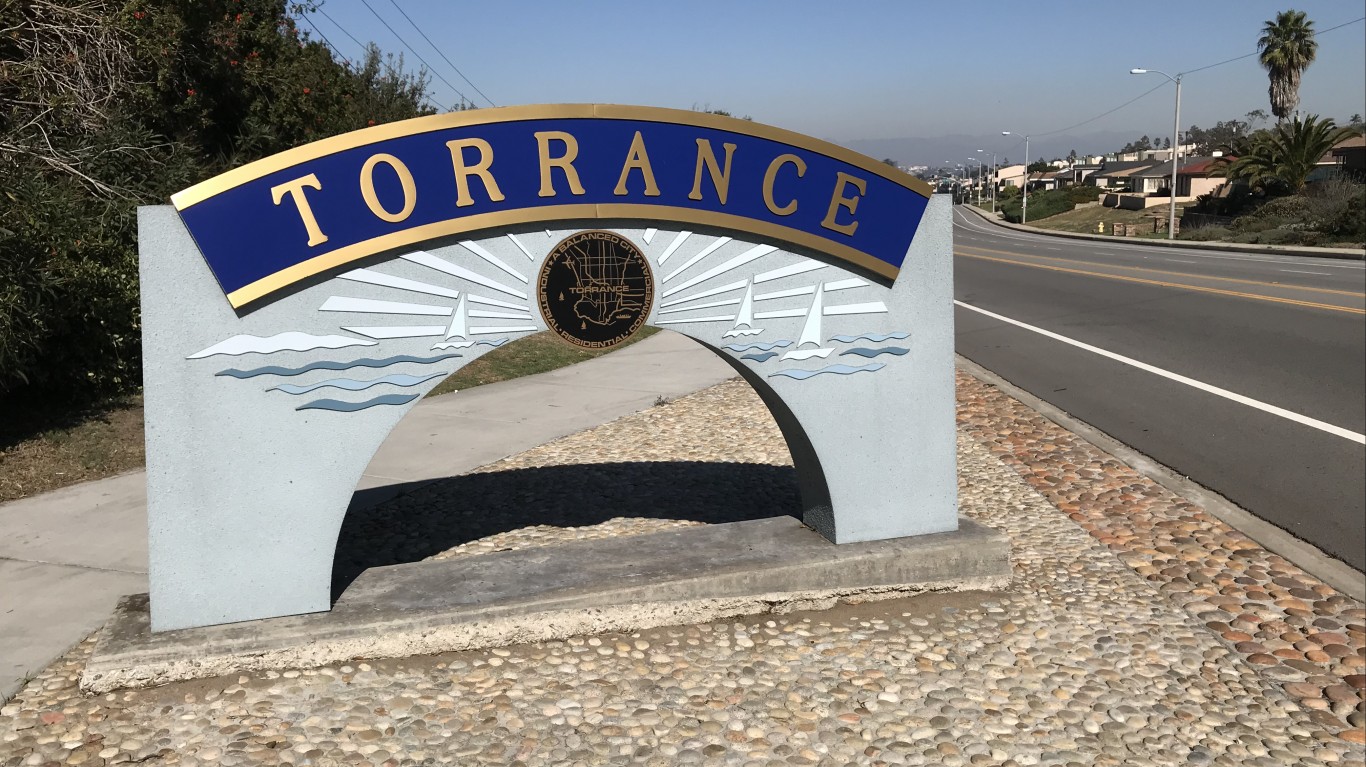
- Infrastructure rank:23/200
- Cost rank:62/200
- Incentives rank:88/200
- Safety rank:74/200
- Overall score:44.86
36. Oceanside, California

- Infrastructure rank:44/200
- Cost rank:119/200
- Incentives rank:52/200
- Safety rank:68/200
- Overall score:45.09
35. Carrollton, Texas
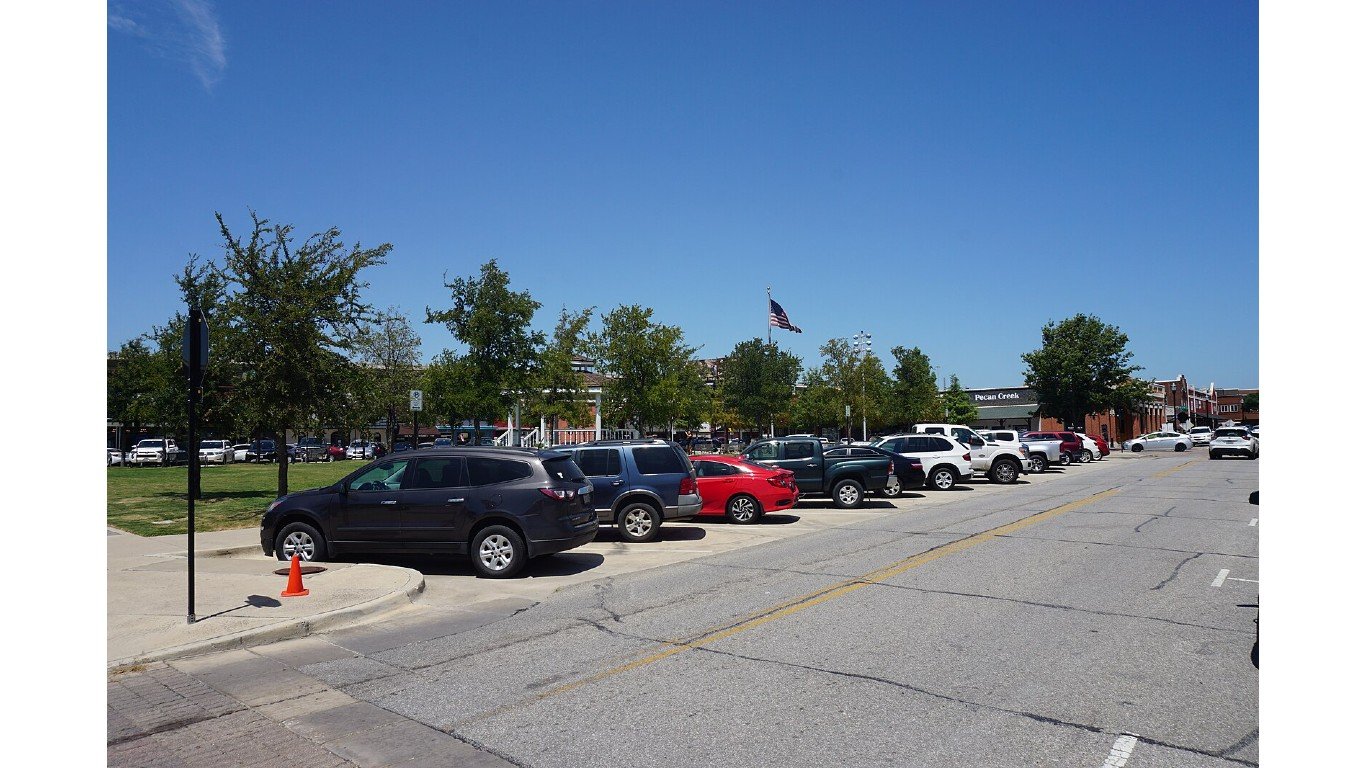
- Infrastructure rank:188/200
- Cost rank:40/200
- Incentives rank:13/200
- Safety rank:35/200
- Overall score:45.2
34. Lakewood, Colorado

- Infrastructure rank:106/200
- Cost rank:43/200
- Incentives rank:30/200
- Safety rank:111/200
- Overall score:45.36
33. Elk Grove, California

- Infrastructure rank:102/200
- Cost rank:25/200
- Incentives rank:71/200
- Safety rank:21/200
- Overall score:45.36
32. Sunnyvale, California
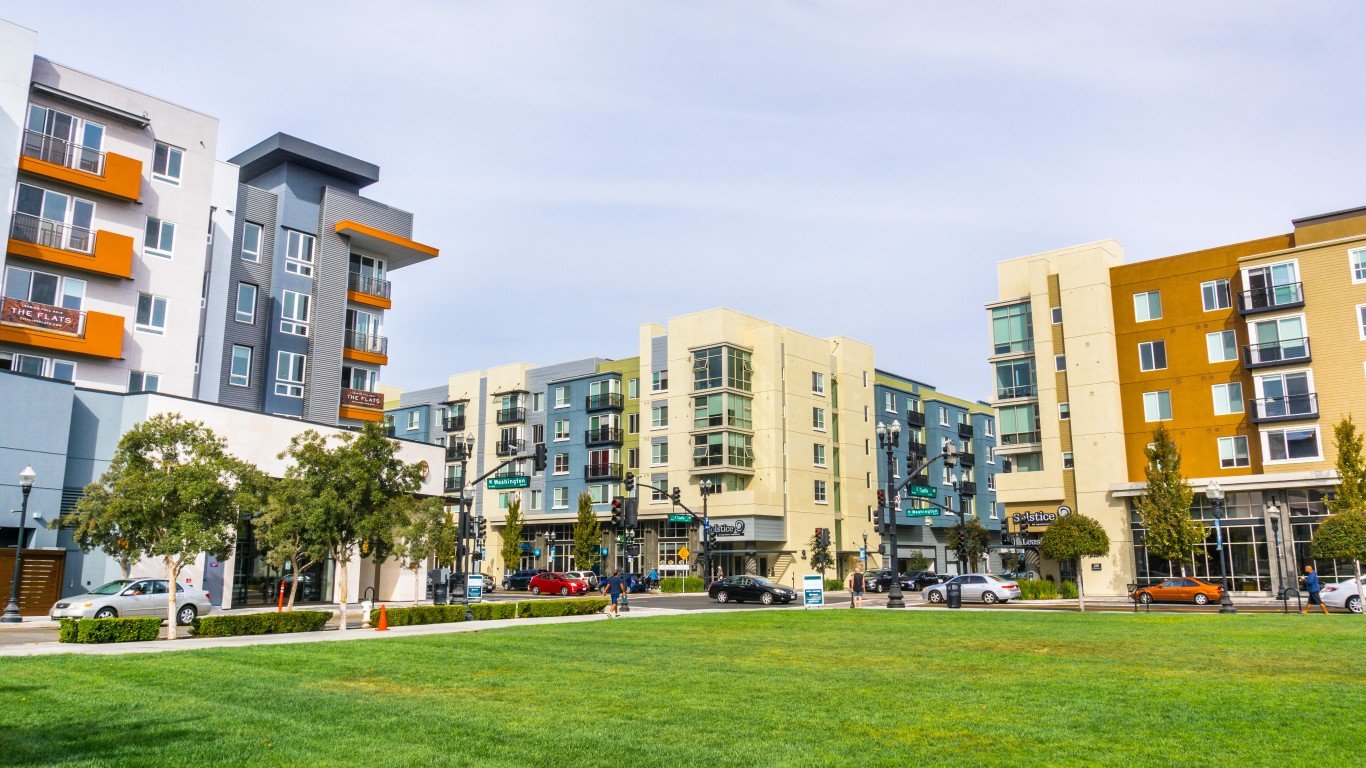
- Infrastructure rank:26/200
- Cost rank:5/200
- Incentives rank:102/200
- Safety rank:61/200
- Overall score:45.5
31. Denton, Texas

- Infrastructure rank:192/200
- Cost rank:79/200
- Incentives rank:8/200
- Safety rank:100/200
- Overall score:45.5
30. Frisco, Texas
- Infrastructure rank:143/200
- Cost rank:4/200
- Incentives rank:68/200
- Safety rank:28/200
- Overall score:45.55
29. Riverside, California

- Infrastructure rank:74/200
- Cost rank:138/200
- Incentives rank:14/200
- Safety rank:133/200
- Overall score:45.81
28. Fort Worth, Texas

- Infrastructure rank:21/200
- Cost rank:76/200
- Incentives rank:50/200
- Safety rank:135/200
- Overall score:45.87
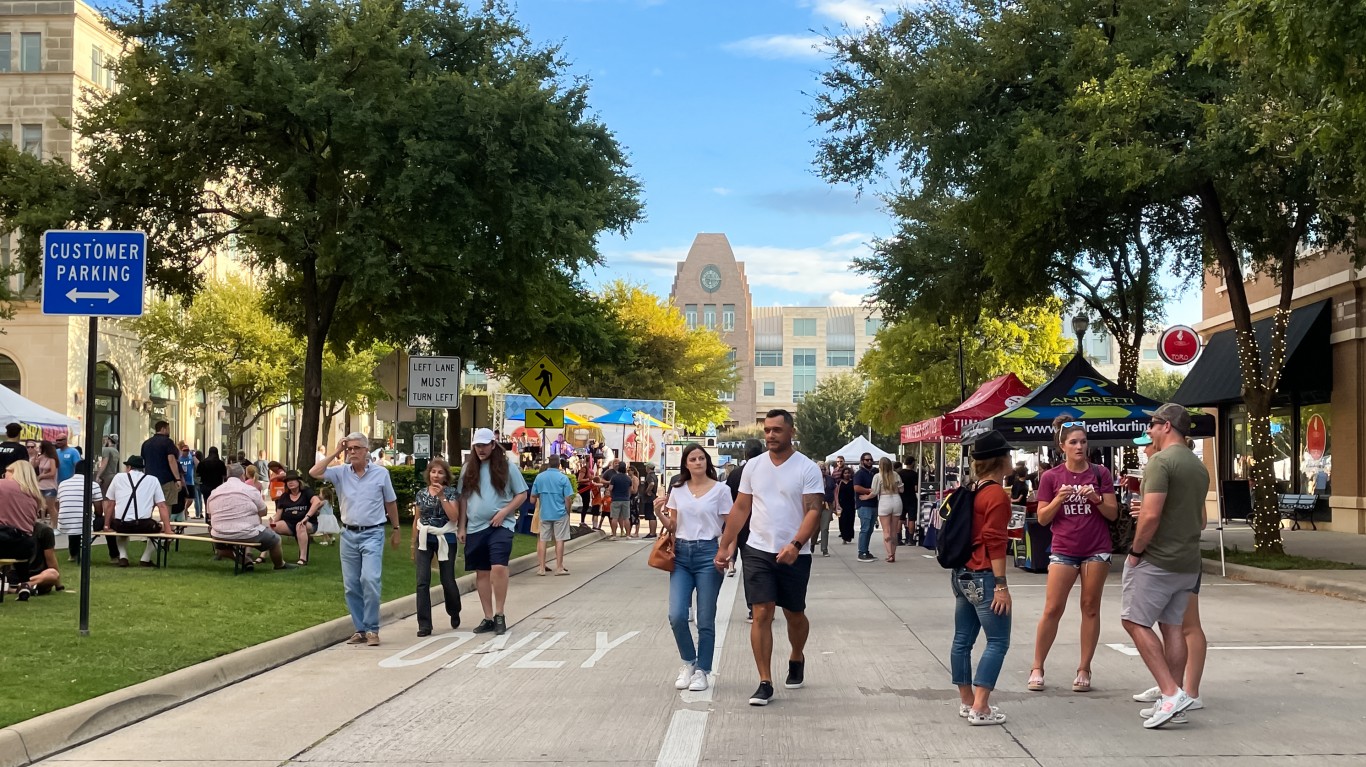
27. Arlington, Texas
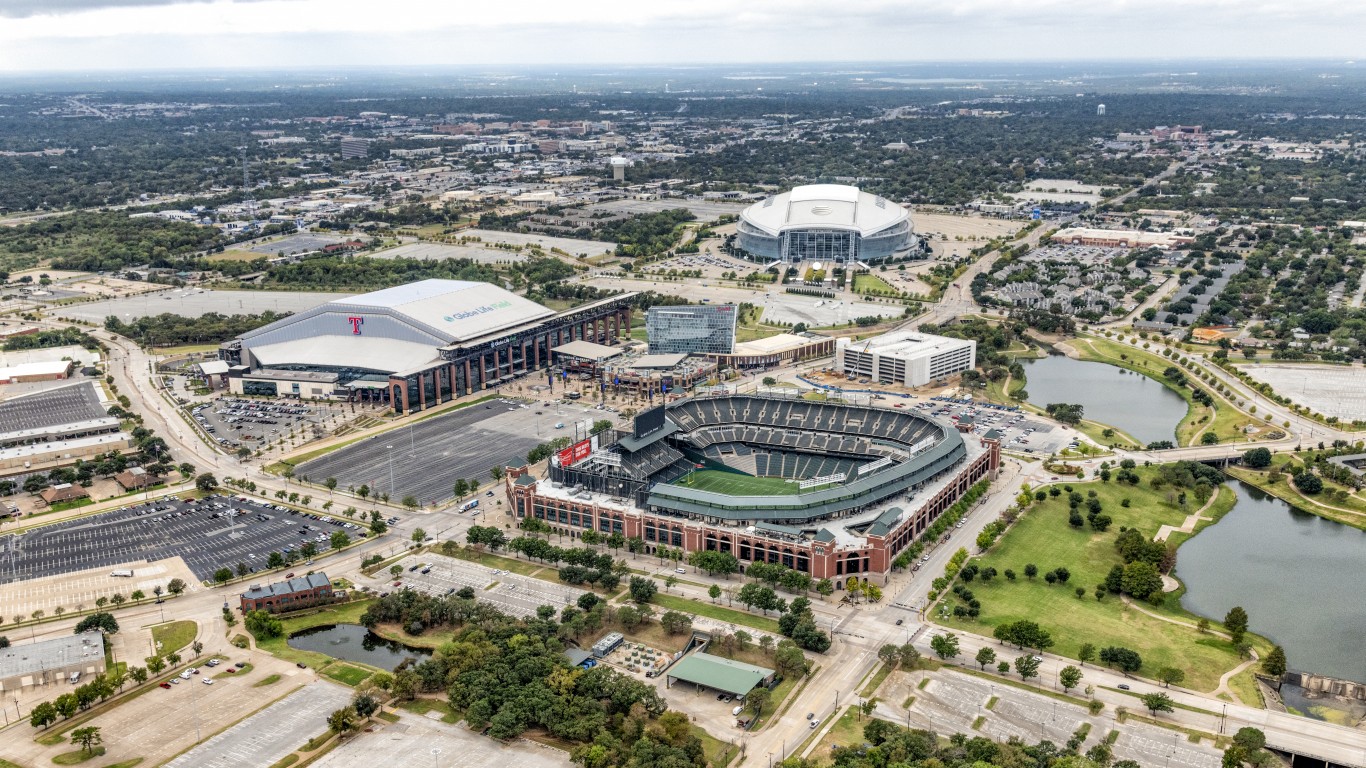
- Infrastructure rank:135/200
- Cost rank:106/200
- Incentives rank:10/200
- Safety rank:155/200
- Overall score:45.88
26. Fullerton, California

- Infrastructure rank:52/200
- Cost rank:67/200
- Incentives rank:41/200
- Safety rank:77/200
- Overall score:46.06
25. Brownsville, Texas

- Infrastructure rank:184/200
- Cost rank:171/200
- Incentives rank:20/200
- Safety rank:2/200
- Overall score:46.27
24. McKinney, Texas
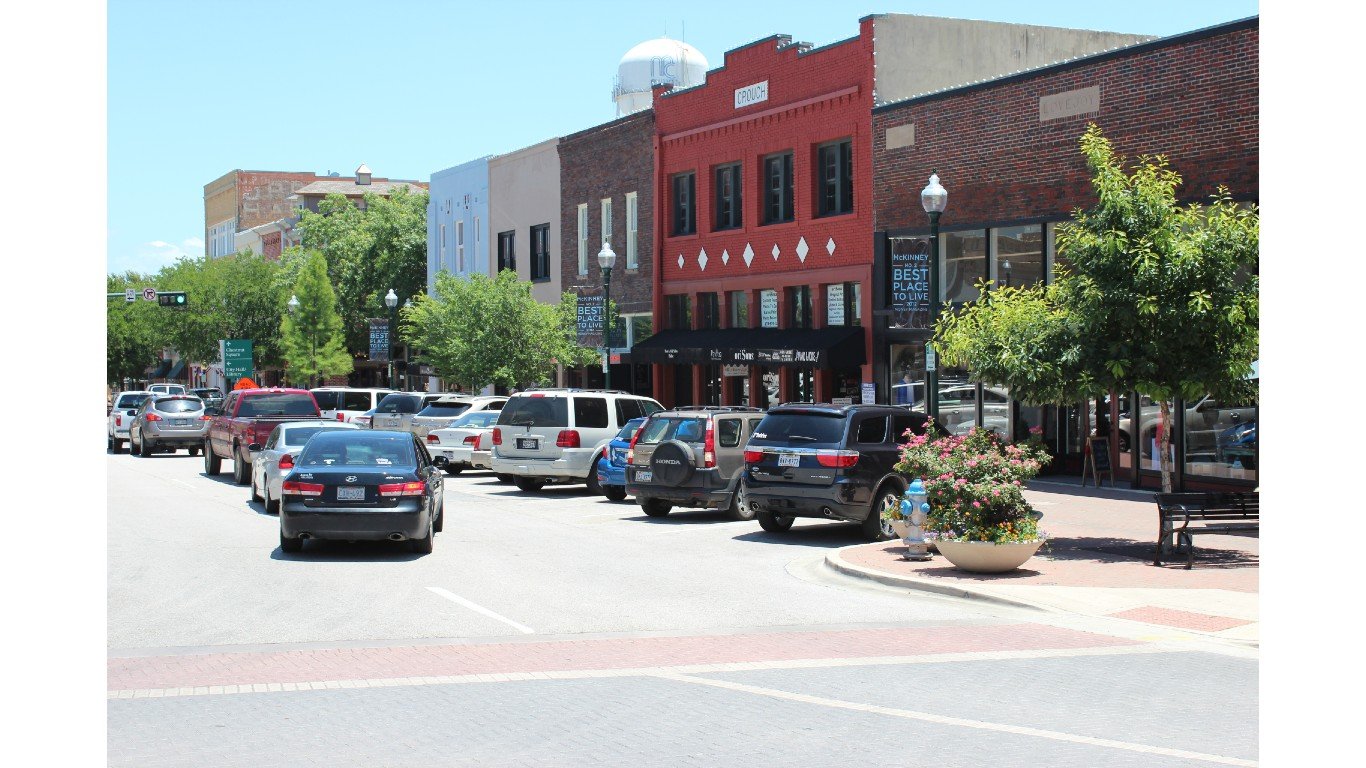
- Infrastructure rank:196/200
- Cost rank:16/200
- Incentives rank:27/200
- Safety rank:24/200
- Overall score:47.04
23. Sacramento, California

- Infrastructure rank:22/200
- Cost rank:103/200
- Incentives rank:25/200
- Safety rank:172/200
- Overall score:47.2
22. Honolulu, Hawaii

- Infrastructure rank:27/200
- Cost rank:195/200
- Incentives rank:6/200
- Safety rank:121/200
- Overall score:47.4
21. Anaheim, California

- Infrastructure rank:30/200
- Cost rank:118/200
- Incentives rank:18/200
- Safety rank:132/200
- Overall score:47.44
20. Huntington Beach, California

- Infrastructure rank:64/200
- Cost rank:49/200
- Incentives rank:33/200
- Safety rank:59/200
- Overall score:47.86
19. Denver, Colorado
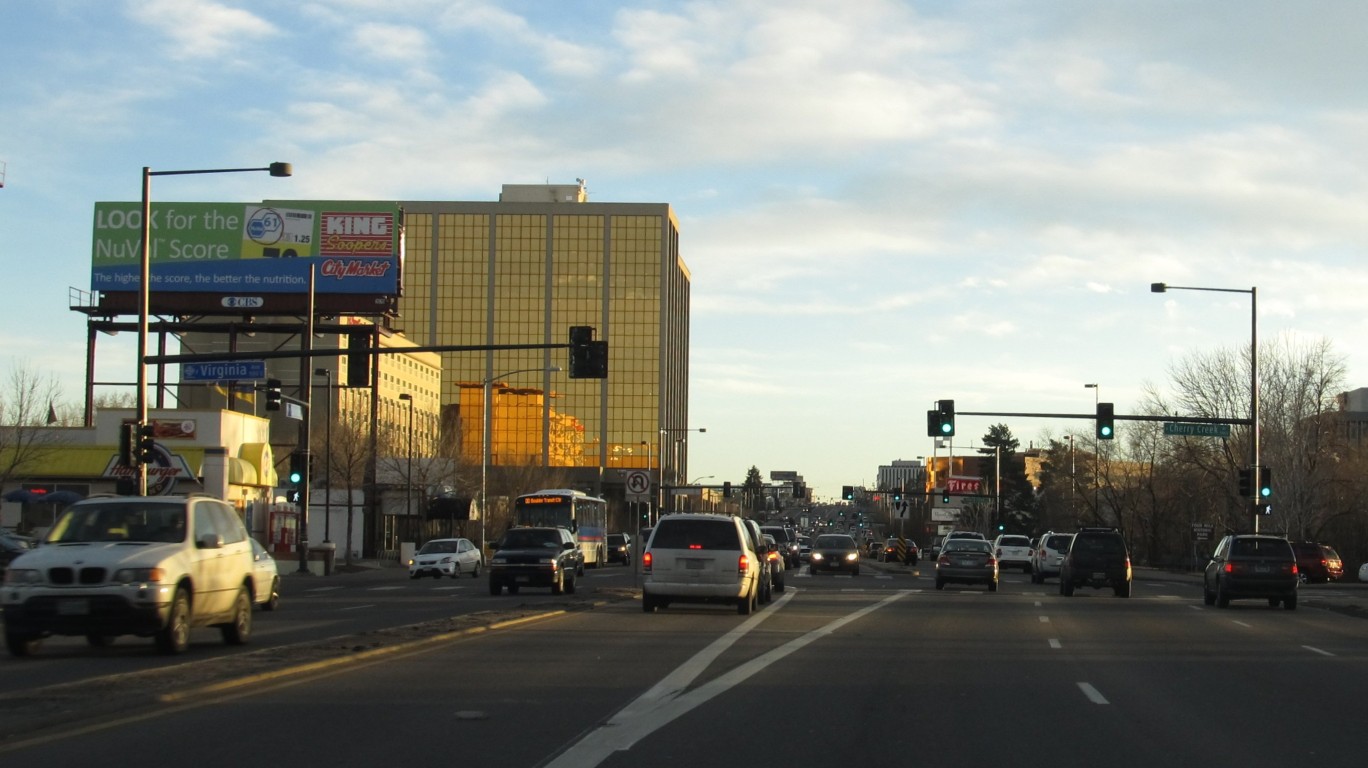
- Infrastructure rank:43/200
- Cost rank:26/200
- Incentives rank:17/200
- Safety rank:163/200
- Overall score:47.88
18. El Paso, Texas

- Infrastructure rank:49/200
- Cost rank:141/200
- Incentives rank:16/200
- Safety rank:53/200
- Overall score:48.33
17. Alexandria, Virginia
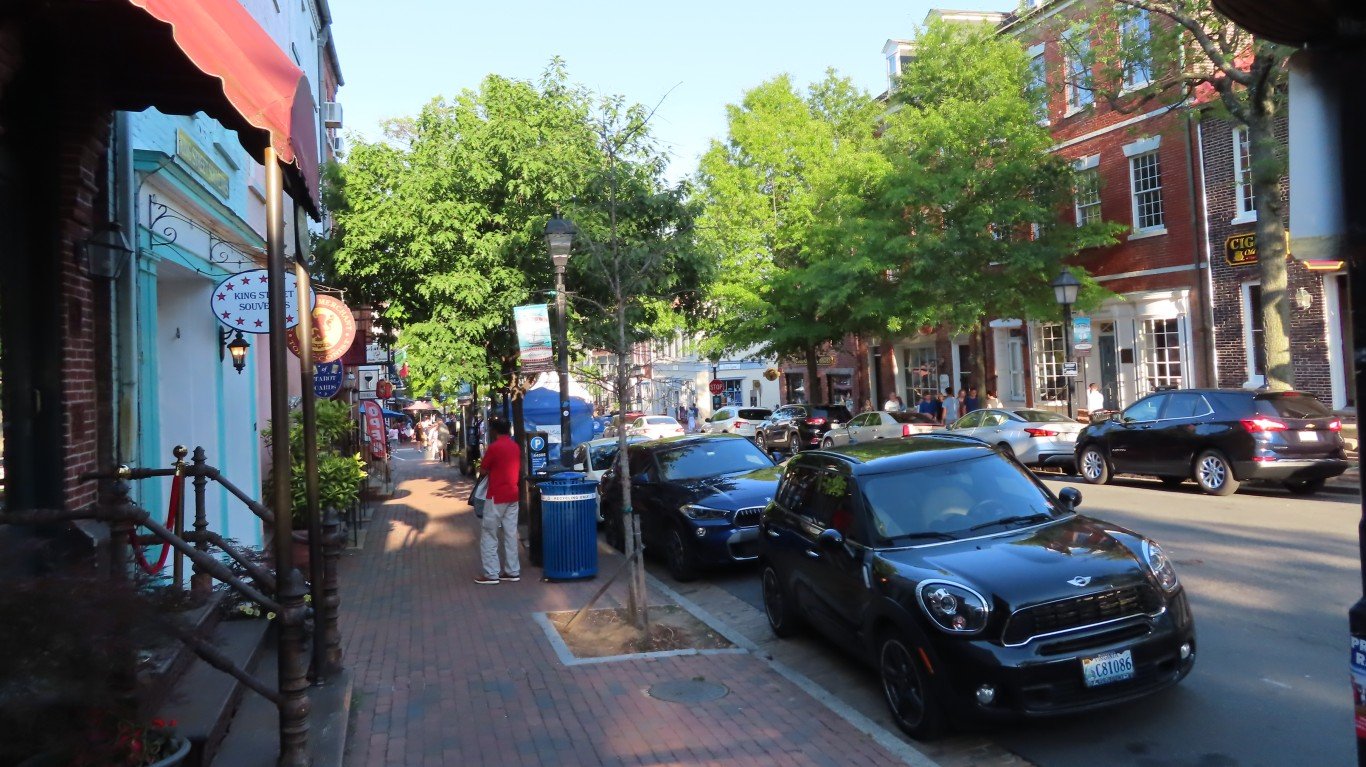
- Infrastructure rank:17/200
- Cost rank:11/200
- Incentives rank:91/200
- Safety rank:105/200
- Overall score:49.1
16. San Jose, California

- Infrastructure rank:8/200
- Cost rank:12/200
- Incentives rank:43/200
- Safety rank:154/200
- Overall score:49.4
15. Scottsdale, Arizona

- Infrastructure rank:31/200
- Cost rank:8/200
- Incentives rank:56/200
- Safety rank:18/200
- Overall score:49.88
14. Orange, California
- Infrastructure rank:13/200
- Cost rank:54/200
- Incentives rank:34/200
- Safety rank:51/200
- Overall score:50.27
13. Plano, Texas
- Infrastructure rank:77/200
- Cost rank:14/200
- Incentives rank:12/200
- Safety rank:54/200
- Overall score:50.65
12. Philadelphia, Pennsylvania

- Infrastructure rank:83/200
- Cost rank:163/200
- Incentives rank:3/200
- Safety rank:136/200
- Overall score:51.01
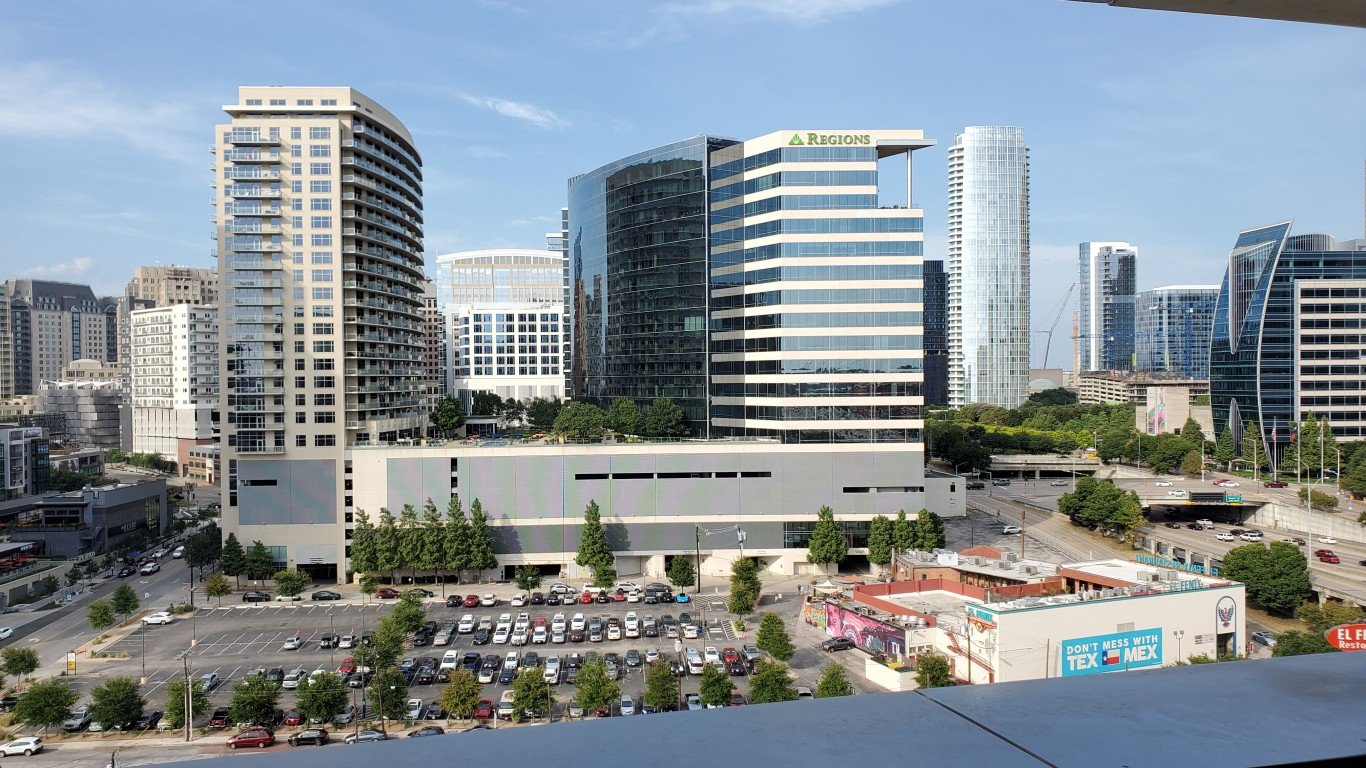
11. Austin, Texas

- Infrastructure rank:7/200
- Cost rank:21/200
- Incentives rank:19/200
- Safety rank:151/200
- Overall score:51.63
10. Chicago, Illinois

- Infrastructure rank:28/200
- Cost rank:52/200
- Incentives rank:9/200
- Safety rank:88/200
- Overall score:51.93
9. San Francisco, California

- Infrastructure rank:47/200
- Cost rank:9/200
- Incentives rank:5/200
- Safety rank:134/200
- Overall score:52.42
8. San Antonio, Texas

- Infrastructure rank:5/200
- Cost rank:104/200
- Incentives rank:15/200
- Safety rank:153/200
- Overall score:53.08
7. Fort Collins, Colorado

- Infrastructure rank:104/200
- Cost rank:20/200
- Incentives rank:7/200
- Safety rank:10/200
- Overall score:53.43
6. Colorado Springs, Colorado
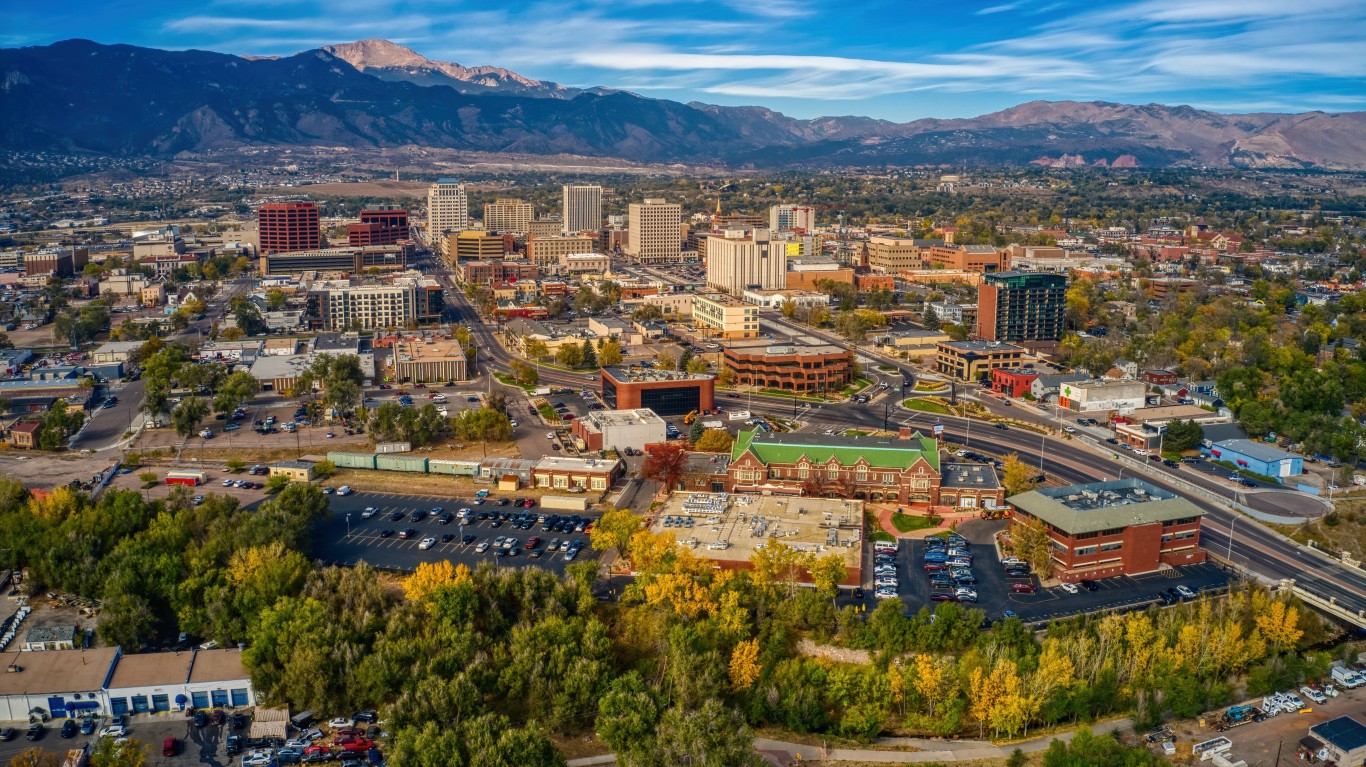
- Infrastructure rank:68/200
- Cost rank:60/200
- Incentives rank:4/200
- Safety rank:60/200
- Overall score:53.81
5. Los Angeles, California
- Infrastructure rank:1/200
- Cost rank:93/200
- Incentives rank:23/200
- Safety rank:184/200
- Overall score:55.77
4. New York, New York

- Infrastructure rank:12/200
- Cost rank:192/200
- Incentives rank:2/200
- Safety rank:23/200
- Overall score:55.86
3. Irvine, California

- Infrastructure rank:4/200
- Cost rank:27/200
- Incentives rank:29/200
- Safety rank:41/200
- Overall score:57.33
2. Houston, Texas

- Infrastructure rank:2/200
- Cost rank:96/200
- Incentives rank:11/200
- Safety rank:175/200
- Overall score:57.67
1. San Diego, California

- Infrastructure rank:6/200
- Cost rank:59/200
- Incentives rank:1/200
- Safety rank:82/200
- Overall score:62.9
The post Taking a Look at the Best EV Cities as Tesla Sales Plunge in California appeared first on 24/7 Wall St..
Click this link for the original source of this article.
Author: 247patrick
This content is courtesy of, and owned and copyrighted by, https://247wallst.com and its author. This content is made available by use of the public RSS feed offered by the host site and is used for educational purposes only. If you are the author or represent the host site and would like this content removed now and in the future, please contact USSANews.com using the email address in the Contact page found in the website menu.