
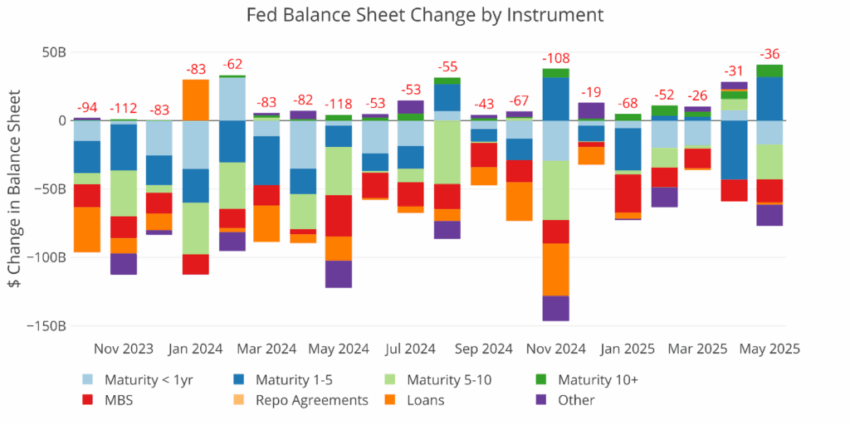
Figure: 1 Monthly Change by Instrument
The table below provides more detail on the Fed’s QT efforts. As shown, the current size of the balance sheet is $6.6T which means it would take over 100 years to fully wind down their balance sheet at the new $5B pace.

Figure: 2 Balance Sheet Breakdown

The weekly activity can be seen below. As shown, it’s been mostly consistent with big chunks along the way. It is also allowing a range of maturities and products to roll off.

Figure: 3 Fed Balance Sheet Weekly Changes
The chart below shows the balance on detailed items in Loans and also Repos. These were the programs set up in the wake of the SVB collapse early last year. All of the programs have dropped down to zero at this point showing that the emergency measures have come to a close.


Figure: 4 Loan Details
Yields
Yields have been fluctuating within a band since Sept 2022, ranging mostly between 3.25% and 4.75%. The 30 year has recently broken out of its range to the upside, signaling a lack of interest in US Government long-term debt.
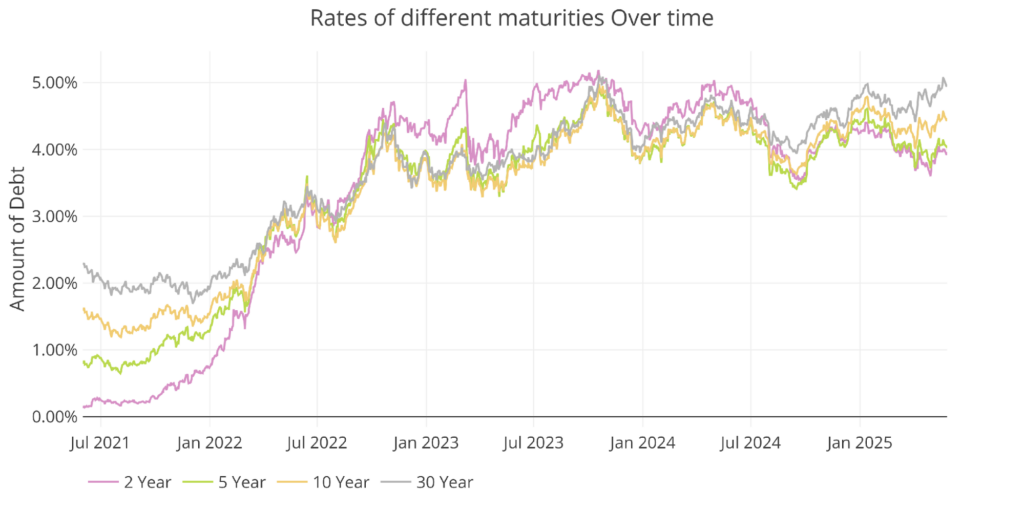
Figure: 5 Interest Rates Across Maturities
The spread between the 2 year and 10 year has finally turned positive. When the inverted yield curve predicts recession, the recession does not usually occur until sometime after the spread turns positive. This ranges between 6 and 18 months. Considering we are hitting the 8 month point now, this could be a bad sign for the months ahead.
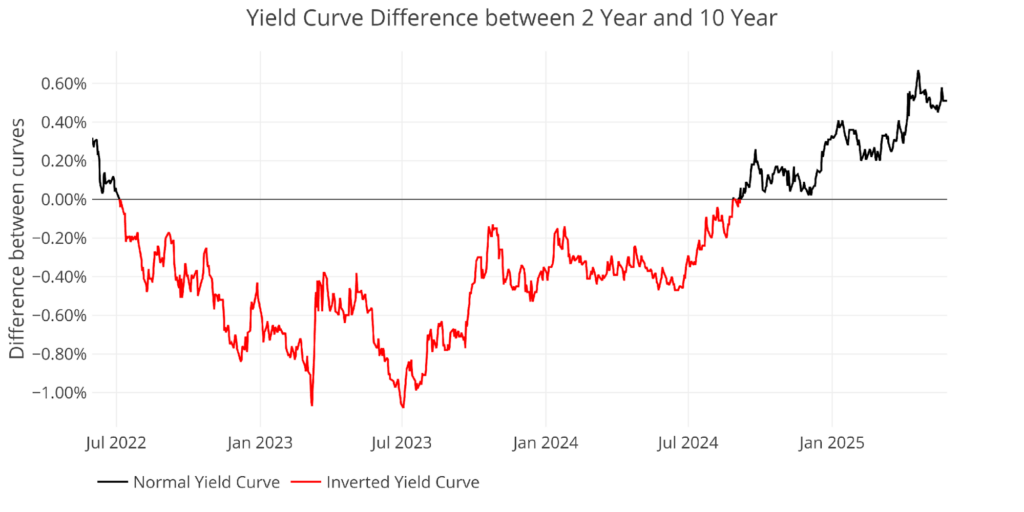
Figure: 6 Tracking Yield Curve Inversion

The chart below shows the current yield curve, the yield curve one month ago, and one year ago. It is clear to see the short-end coming down while the long-end has remained mostly flat.

Figure: 7 Tracking Yield Curve Inversion
The Fed Takes Losses
When the Fed makes money, it sends it back to the Treasury. This has netted the Treasury close to $100B a year. This can be seen below.

Figure: 8 Fed Payments to Treasury
You may notice in the chart above that 2023 and 2024 are showing $0. That’s because the Fed has been losing money. According to the Fed: The Federal Reserve Banks remit residual net earnings to the U.S. Treasury after providing for the costs of operations… Positive amounts represent the estimated weekly remittances due to U.S. Treasury. Negative amounts represent the cumulative deferred asset position … deferred asset is the amount of net earnings that the Federal Reserve Banks need to realize before remittances to the U.S. Treasury resume.
Basically, when the Fed makes money, it gives it to the Treasury. When it loses money, it keeps a negative balance by printing the difference. That negative balance has just exceeded $229B!
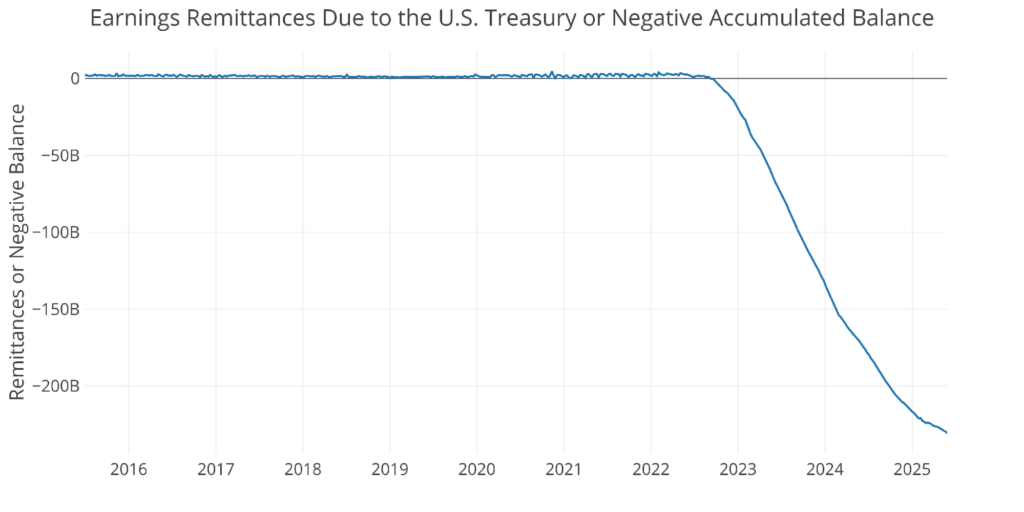
Figure: 9 Remittances or Negative Balance
Who Will Fill the Gap?
The Fed has not been buying in the Treasury market for over a year (they have been selling); however, the Treasury is still issuing tons of new debt. Who has been picking up the slack since the Fed stepped away?
International holdings have increased a decent amount over the last year by over $750B. Unfortunately, this pales in comparison to the amount of debt issued by the Treasury overall which is closer to $2T.
The recent increase in holdings is not shown in the detailed treasury report, classifying most of the increase as “All Other”. The countries that can be seen increasing holdings are Norway, Cayman Islands, UK, Switzerland, and Canada. On the other side, the biggest countries reducing debt is China, UAE, Hong Kong, and Ireland.
Note: data is updated on a lag. The latest data is as of March

Figure: 10 International Holders
It should be noted that China continues to reduce holdings of US Treasuries. They have dropped $500B over the last decade, while Japan has been mostly flat over the same time. The slack has been picked up by other countries.
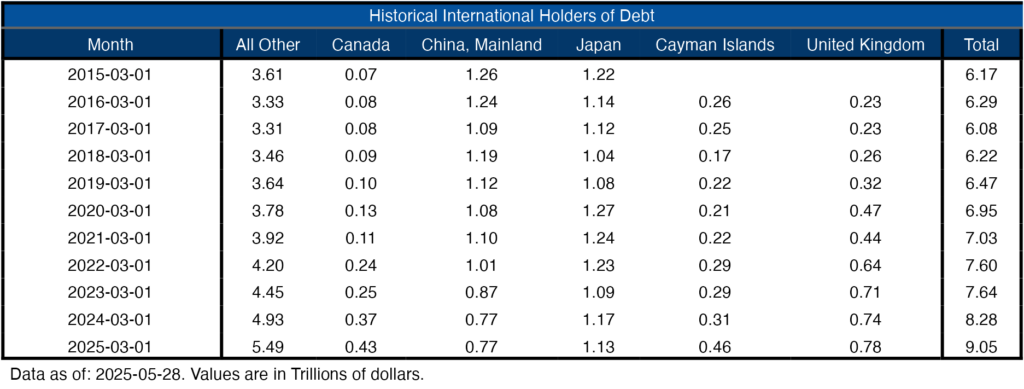
Figure: 11 Average Weekly Change in the Balance Sheet
Historical Perspective
The final plot below takes a larger view of the balance sheet. It is clear to see how the usage of the balance sheet has changed since the Global Financial Crisis.

Figure: 12 Historical Fed Balance Sheet
QTR’s Take
As I said yesterday in my full portfolio review, I continue to believe that gold and silver miners represent a strategic way to gain leveraged exposure to the underlying precious metals—especially now that they’re showing signs of outperforming the metals themselves.
For the past year, miners have been held back by broader market worries—such as management risks, capital costs, and general risk aversion—but recent price action suggests that sentiment is shifting. The fact that miners are finally leading the metals higher hints at growing investor confidence in the durability of this precious metals bull market.
This is especially compelling given the above Fed’s persistently bloated balance sheet and the national debt, both of which continue to expand at an alarming rate.
In such an environment, hard assets like gold and silver—and by extension, the miners who extract them—should act as a hedge against the erosion of fiat currency purchasing power.
With monetary policy likely to remain loose and fiscal irresponsibility the status quo, gold and silver miners stand out as one of the best risk-reward plays in this late-cycle environment.

QTR’s Disclaimer: Please read my full legal disclaimer on my About page here. This post represents my opinions only. In addition, please understand I am an idiot and often get things wrong and lose money. I may own or transact in any names mentioned in this piece at any time without warning. Contributor posts and aggregated posts have been hand selected by me, have not been fact checked and are the opinions of their authors. They are either submitted to QTR by their author, reprinted under a Creative Commons license with my best effort to uphold what the license asks, or with the permission of the author.
This is not a recommendation to buy or sell any stocks or securities, just my opinions. I often lose money on positions I trade/invest in. I may add any name mentioned in this article and sell any name mentioned in this piece at any time, without further warning. None of this is a solicitation to buy or sell securities. I may or may not own names I write about and are watching. Sometimes I’m bullish without owning things, sometimes I’m bearish and do own things. Just assume my positions could be exactly the opposite of what you think they are just in case. If I’m long I could quickly be short and vice versa. I won’t update my positions. All positions can change immediately as soon as I publish this, with or without notice and at any point I can be long, short or neutral on any position. You are on your own. Do not make decisions based on my blog. I exist on the fringe. The publisher does not guarantee the accuracy or completeness of the information provided in this page. These are not the opinions of any of my employers, partners, or associates. I did my best to be honest about my disclosures but can’t guarantee I am right; I write these posts after a couple beers sometimes. I edit after my posts are published because I’m impatient and lazy, so if you see a typo, check back in a half hour. Also, I just straight up get shit wrong a lot. I mention it twice because it’s that important.