Every year in the United States, tens of millions of Americans move to a new home. According to the U.S. Census Bureau, the bulk of these moves are motivated by personal circumstances, often relating to housing, family, or employment. But when it comes to deciding on a place to live, it can also be helpful to weigh other, less subjective factors.
As a means of gauging and comparing degrees of development between countries — beyond standard measures like gross domestic product and economic growth — the United Nations created the Human Development Index. By accounting for factors related to health and well-being, educational attainment, and standards of living, the HDI offers an assessment of overall quality of life at the individual level within a given geography.
When applied to communities within the United States, the core principles of the HDI reveal that some parts of the country are far better places to live than others.

Using an index inspired by the HDI, 24/7 Wall St. identified the best counties in California to live in. Counties are ranked on a combination of three measures – average life expectancy at birth, the share of adults with a bachelor’s degree or higher, and the poverty rate. Of the 57 counties in California with sufficient data, we ranked the 30 with the highest HDI score.
Across all of California, average life expectancy at birth is 81 years. Additionally, 12.1% of the population live below the poverty line and 35.9% of adults have a bachelor’s degree or higher. Of the 30 counties on this list, 13 compare favorably to the state as a whole in each of these metrics.
Among these 30 California counties, average life expectancy at birth ranges from 78.3 years to over 100. Meanwhile, poverty rates vary between 6.4% and 17.4%, and bachelor’s degree attainment rates range from about 20% to over 60%.

Data used to calculate rankings are from the U.S. Census Bureau’s 2022 American Community Survey and County Health Rankings & Roadmaps, a joint program of the Robert Wood Johnson Foundation and the University of Wisconsin Population Health Institute. All ACS data are five-year averages.
Why It Matters
Many of the most commonly cited economic indicators — including unemployment, GDP, and industrial output — are useful gauges of prosperity and productive capacity in a given area. But when it comes to measuring overall quality of life, any single metric inevitably falls short. To address these shortcomings, the HDI combines three key social and economic measures into a single index score, allowing for objective comparisons between communities across the United States.
30. Tuolumne County

- Avg. life expectancy at birth: 78.3 years
- Poverty rate: 11.4%
- Adults with a bachelor’s degree: 24.4%
- Median household income: $70,432
- Population: 54,993
29. Mariposa County
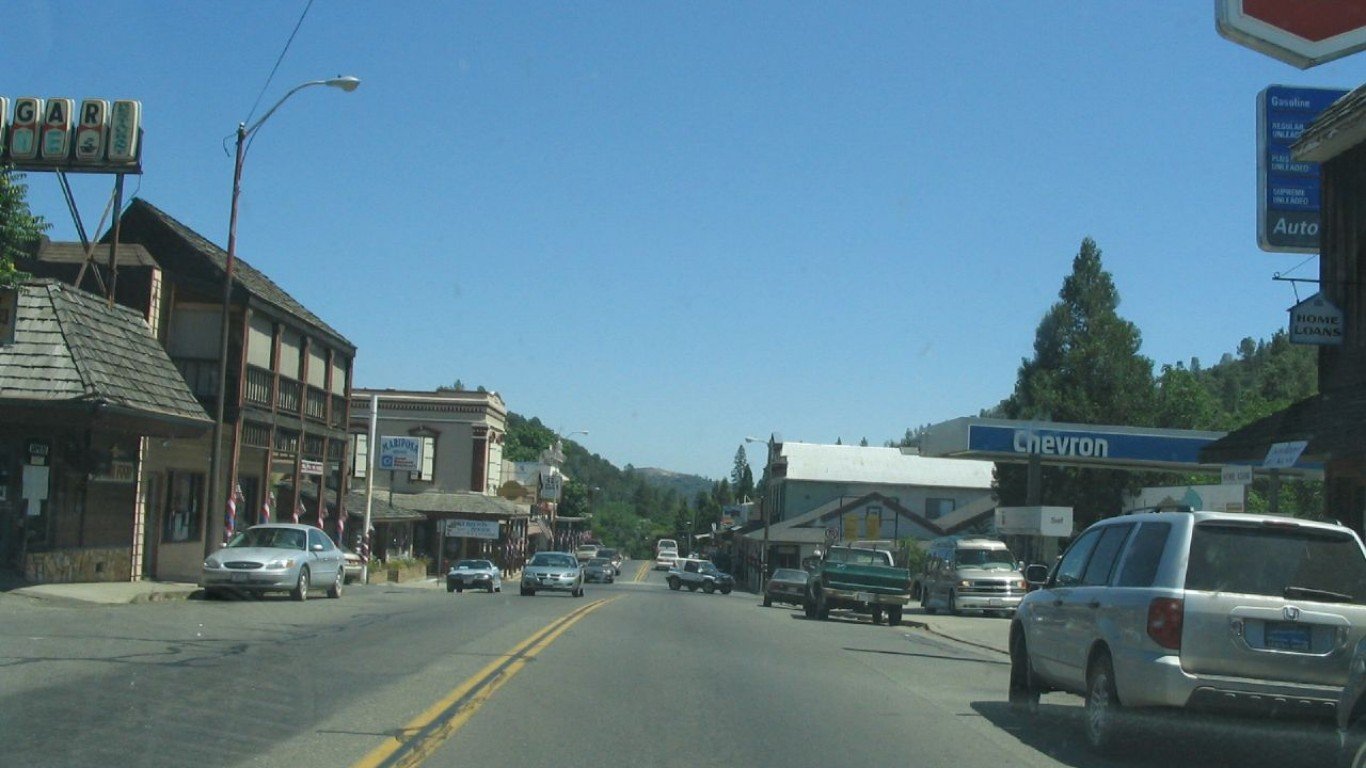
- Avg. life expectancy at birth: 80.6 years
- Poverty rate: 16.0%
- Adults with a bachelor’s degree: 28.9%
- Median household income: $60,021
- Population: 17,130
28. Sierra County

- Avg. life expectancy at birth: 81.0 years
- Poverty rate: 12.6%
- Adults with a bachelor’s degree: 23.9%
- Median household income: $61,108
- Population: 2,916
27. Riverside County
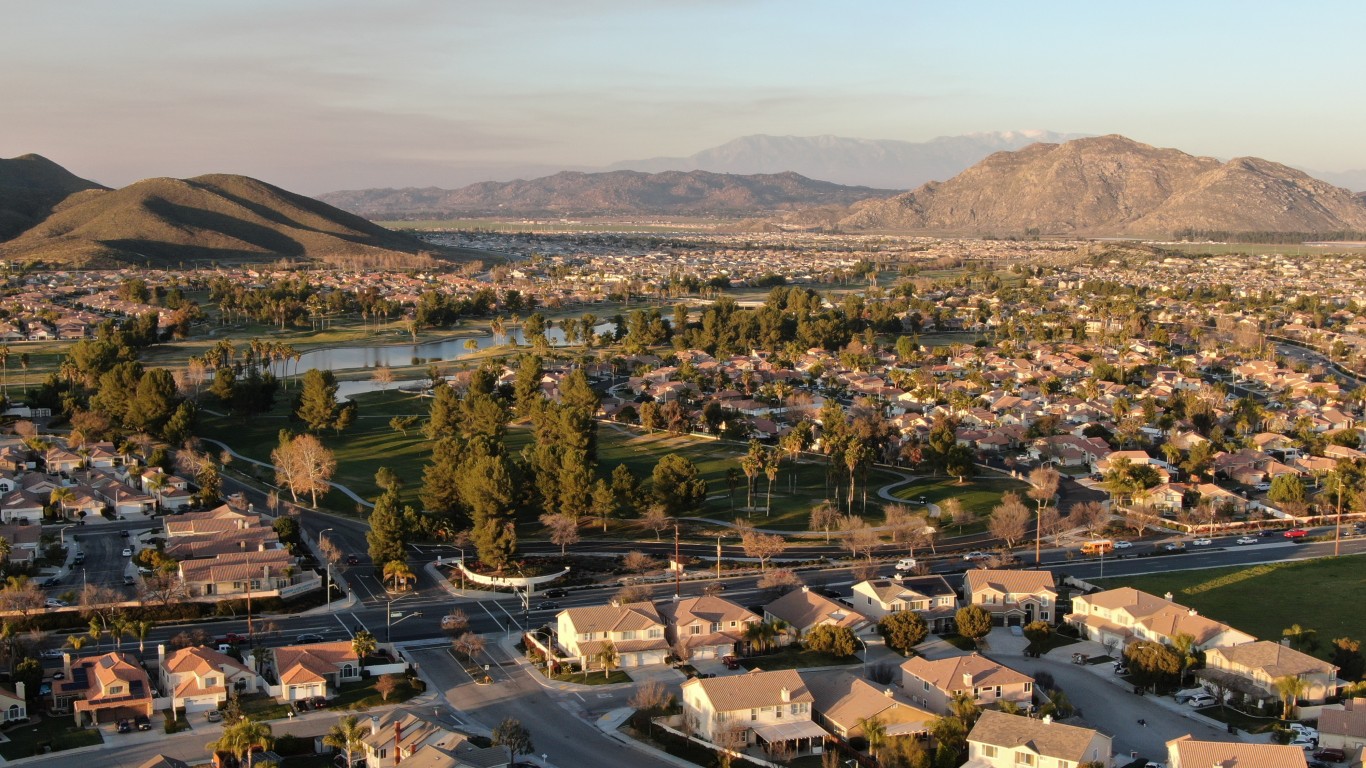
- Avg. life expectancy at birth: 80.0 years
- Poverty rate: 11.4%
- Adults with a bachelor’s degree: 24.1%
- Median household income: $84,505
- Population: 2,429,487
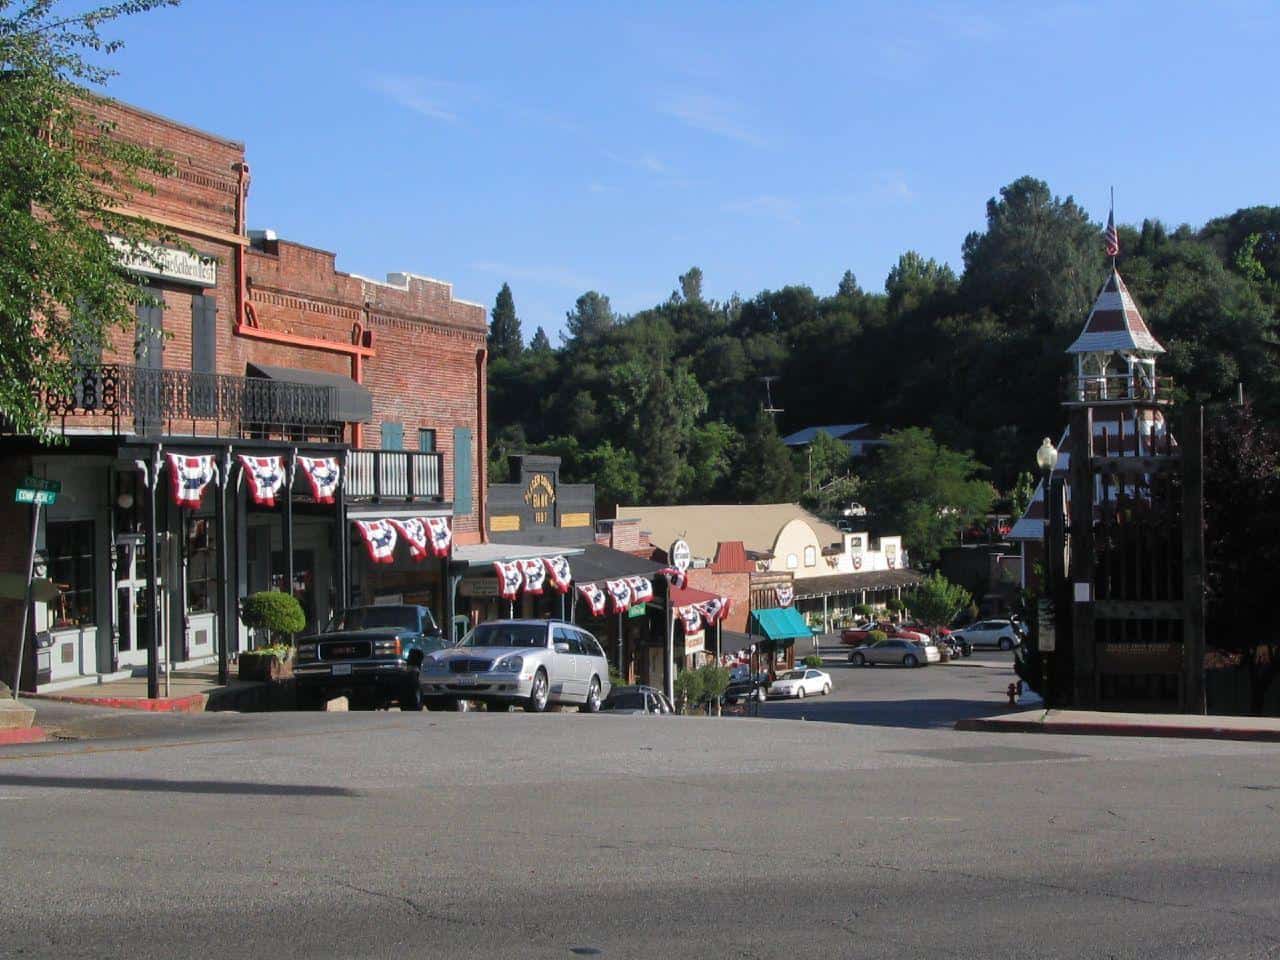
26. Amador County

- Avg. life expectancy at birth: 79.8 years
- Poverty rate: 7.8%
- Adults with a bachelor’s degree: 20.6%
- Median household income: $74,853
- Population: 40,577
25. Inyo County
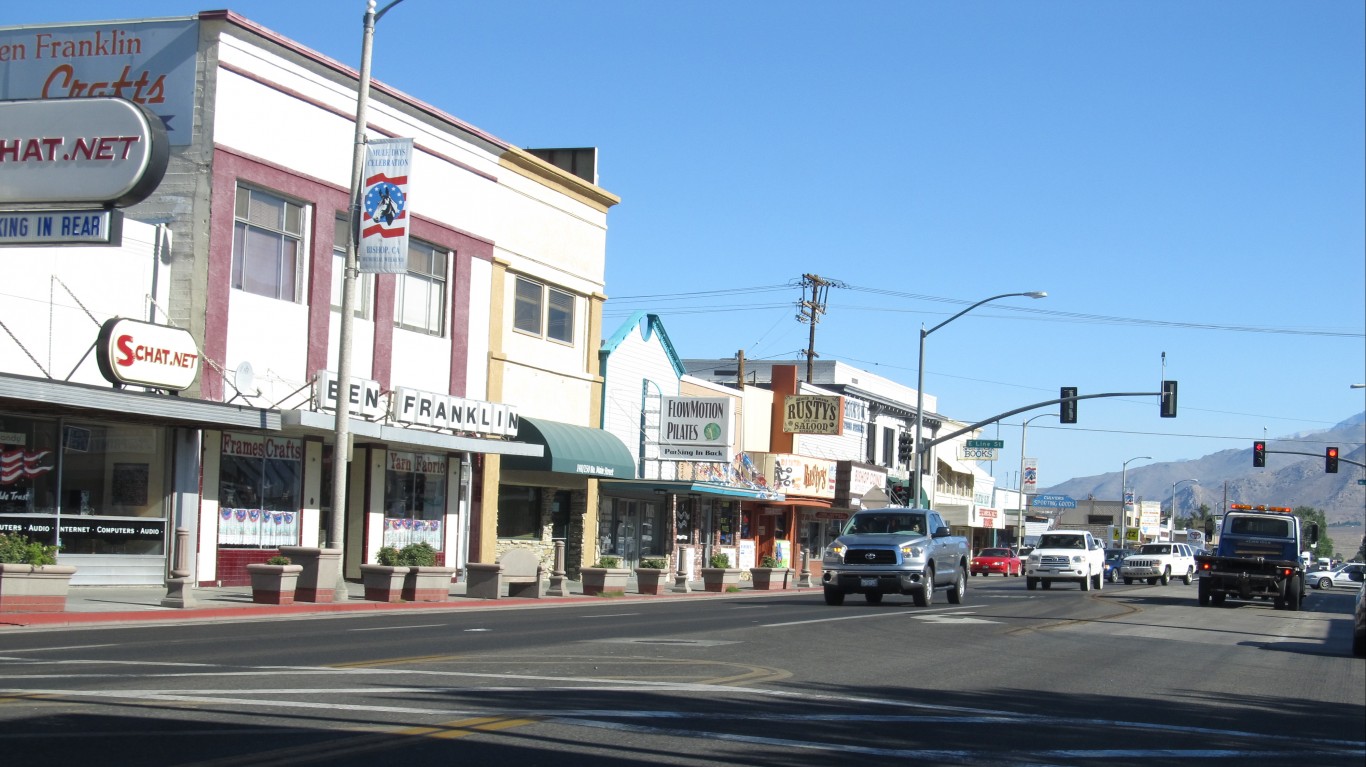
- Avg. life expectancy at birth: 78.7 years
- Poverty rate: 11.9%
- Adults with a bachelor’s degree: 29.0%
- Median household income: $63,417
- Population: 18,829
24. Monterey County
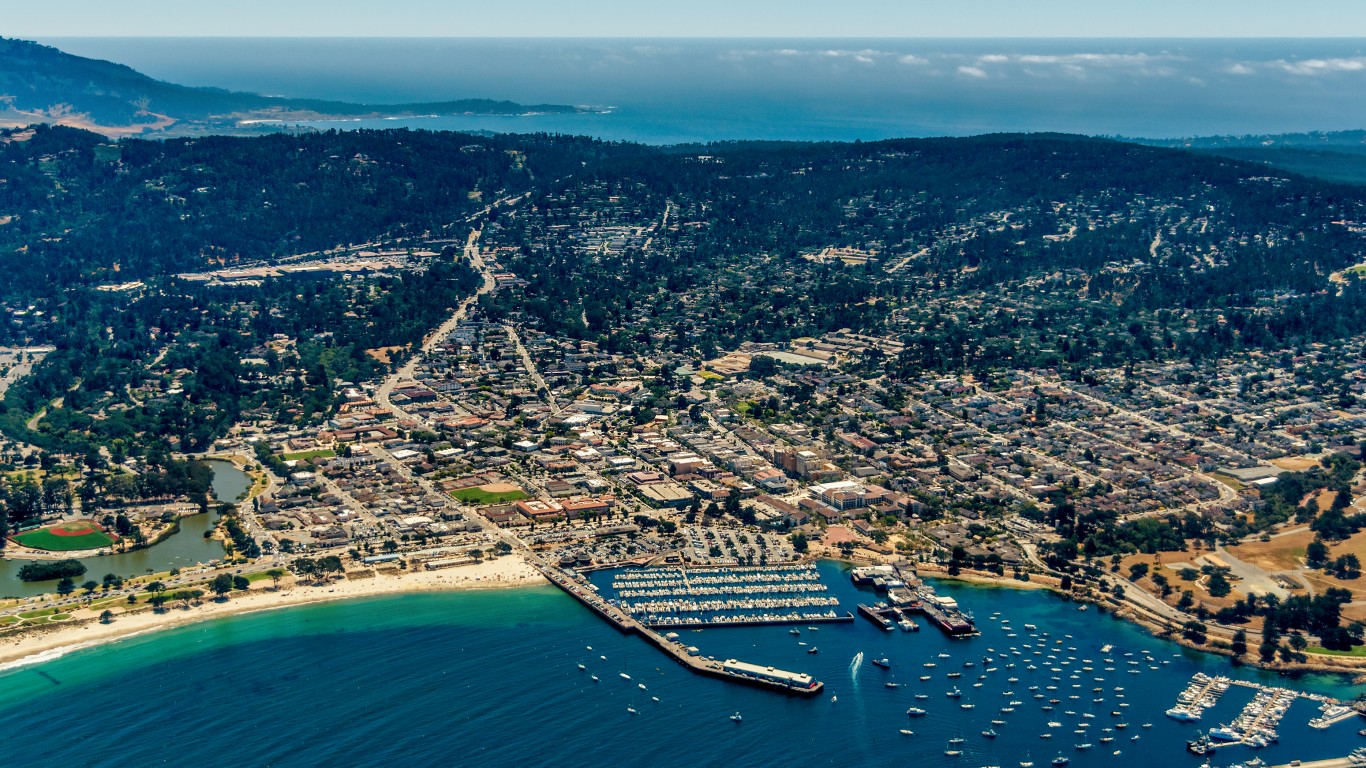
- Avg. life expectancy at birth: 82.2 years
- Poverty rate: 12.3%
- Adults with a bachelor’s degree: 27.1%
- Median household income: $91,043
- Population: 437,609
23. Sacramento County

- Avg. life expectancy at birth: 79.2 years
- Poverty rate: 13.1%
- Adults with a bachelor’s degree: 32.6%
- Median household income: $84,010
- Population: 1,579,211
22. San Benito County

- Avg. life expectancy at birth: 81.9 years
- Poverty rate: 7.5%
- Adults with a bachelor’s degree: 22.0%
- Median household income: $104,451
- Population: 64,753
21. Solano County

- Avg. life expectancy at birth: 80.0 years
- Poverty rate: 9.0%
- Adults with a bachelor’s degree: 28.2%
- Median household income: $97,037
- Population: 450,995
20. Los Angeles County

- Avg. life expectancy at birth: 81.3 years
- Poverty rate: 13.7%
- Adults with a bachelor’s degree: 34.6%
- Median household income: $83,411
- Population: 9,936,690
19. Santa Barbara County
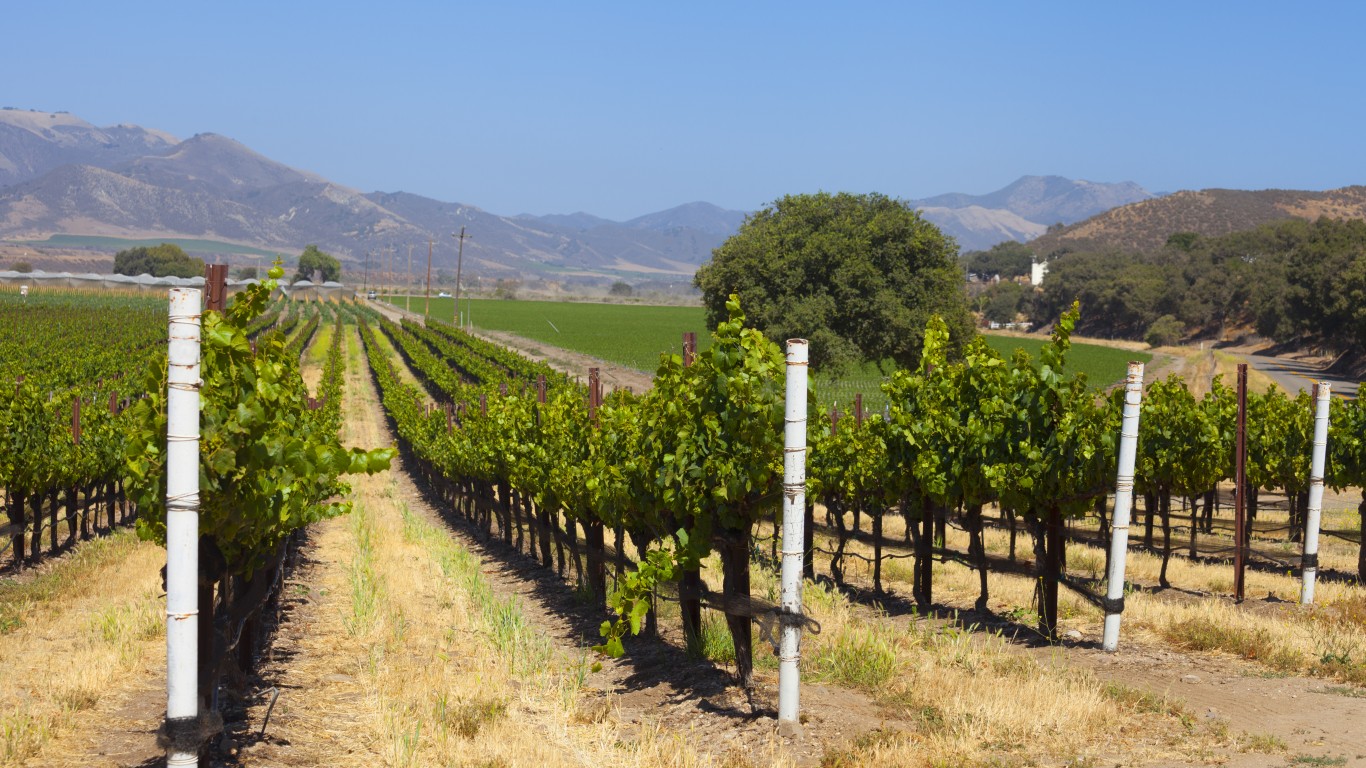
- Avg. life expectancy at birth: 81.8 years
- Poverty rate: 13.5%
- Adults with a bachelor’s degree: 35.7%
- Median household income: $92,332
- Population: 445,213
18. Yolo County

- Avg. life expectancy at birth: 81.5 years
- Poverty rate: 17.4%
- Adults with a bachelor’s degree: 43.3%
- Median household income: $85,097
- Population: 217,141
17. San Luis Obispo County
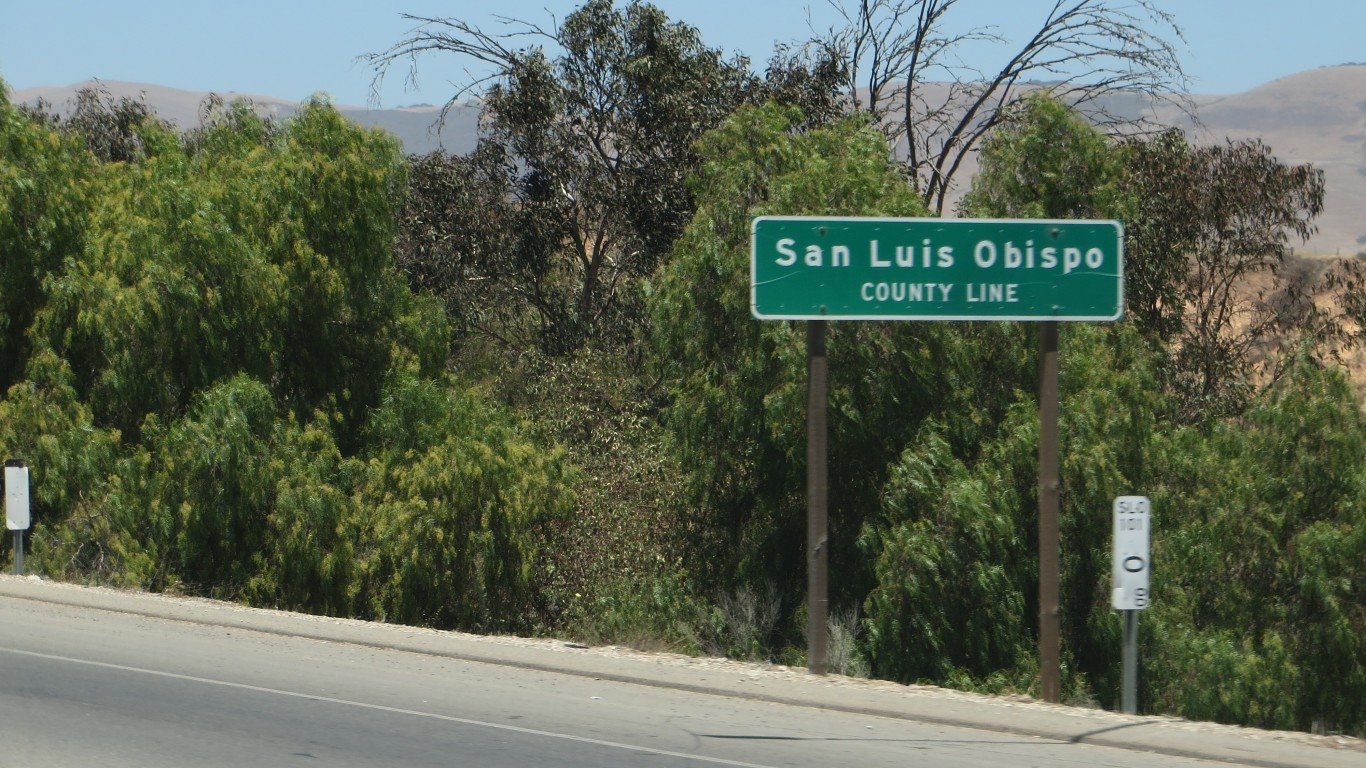
- Avg. life expectancy at birth: 81.8 years
- Poverty rate: 12.6%
- Adults with a bachelor’s degree: 38.0%
- Median household income: $90,158
- Population: 281,712
16. Ventura County
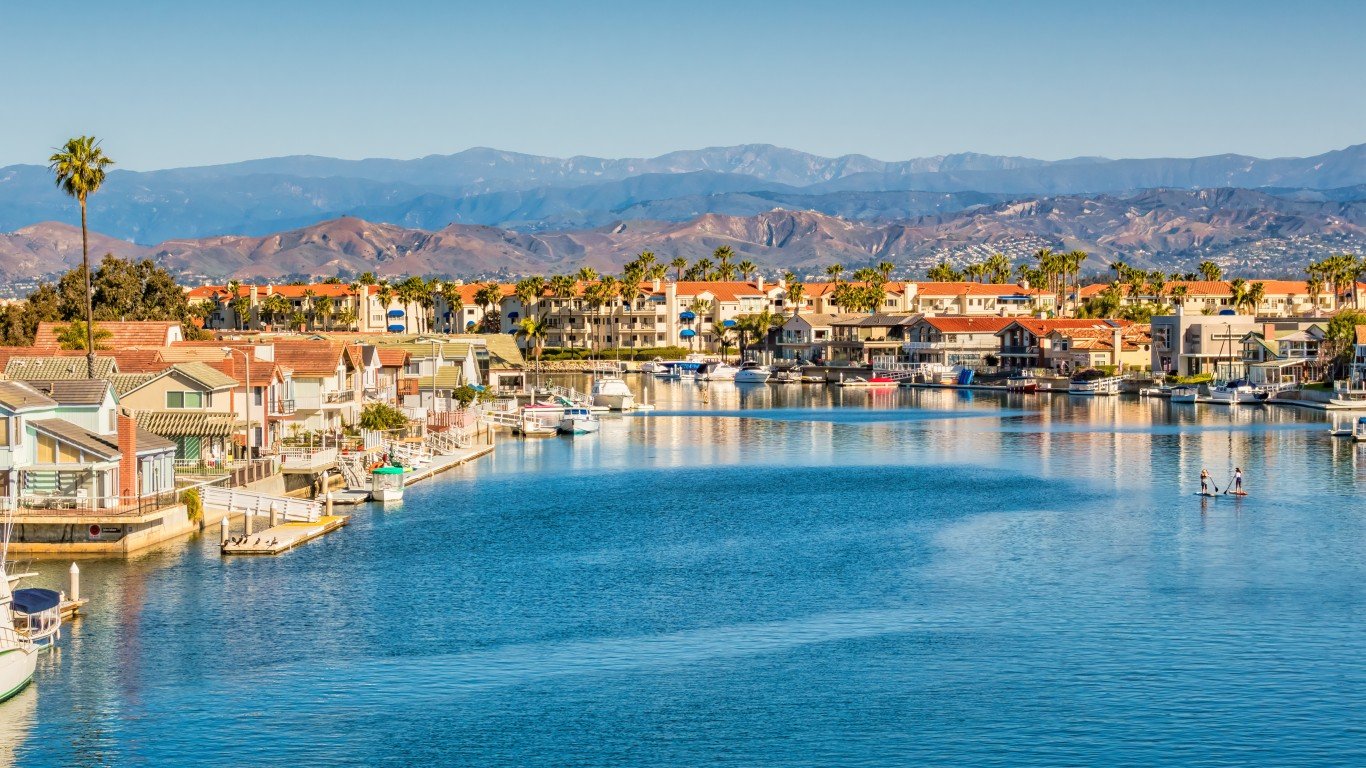
- Avg. life expectancy at birth: 82.3 years
- Poverty rate: 9.0%
- Adults with a bachelor’s degree: 34.7%
- Median household income: $102,141
- Population: 842,009
15. Nevada County


- Avg. life expectancy at birth: 80.8 years
- Poverty rate: 10.4%
- Adults with a bachelor’s degree: 38.8%
- Median household income: $79,395
- Population: 102,322
14. Sonoma County
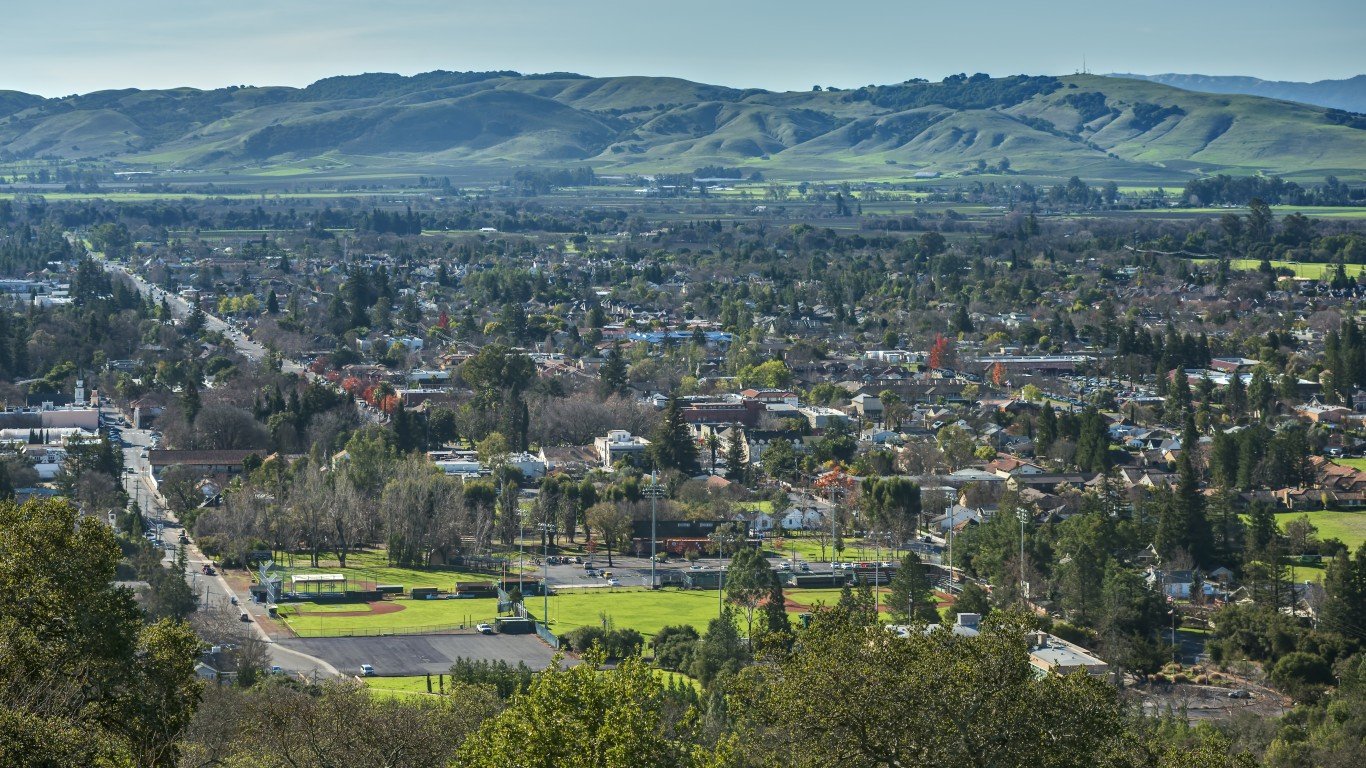
- Avg. life expectancy at birth: 82.0 years
- Poverty rate: 8.9%
- Adults with a bachelor’s degree: 37.8%
- Median household income: $99,266
- Population: 488,436
13. El Dorado County
- Avg. life expectancy at birth: 81.9 years
- Poverty rate: 8.6%
- Adults with a bachelor’s degree: 38.0%
- Median household income: $99,246
- Population: 191,713
12. San Diego County
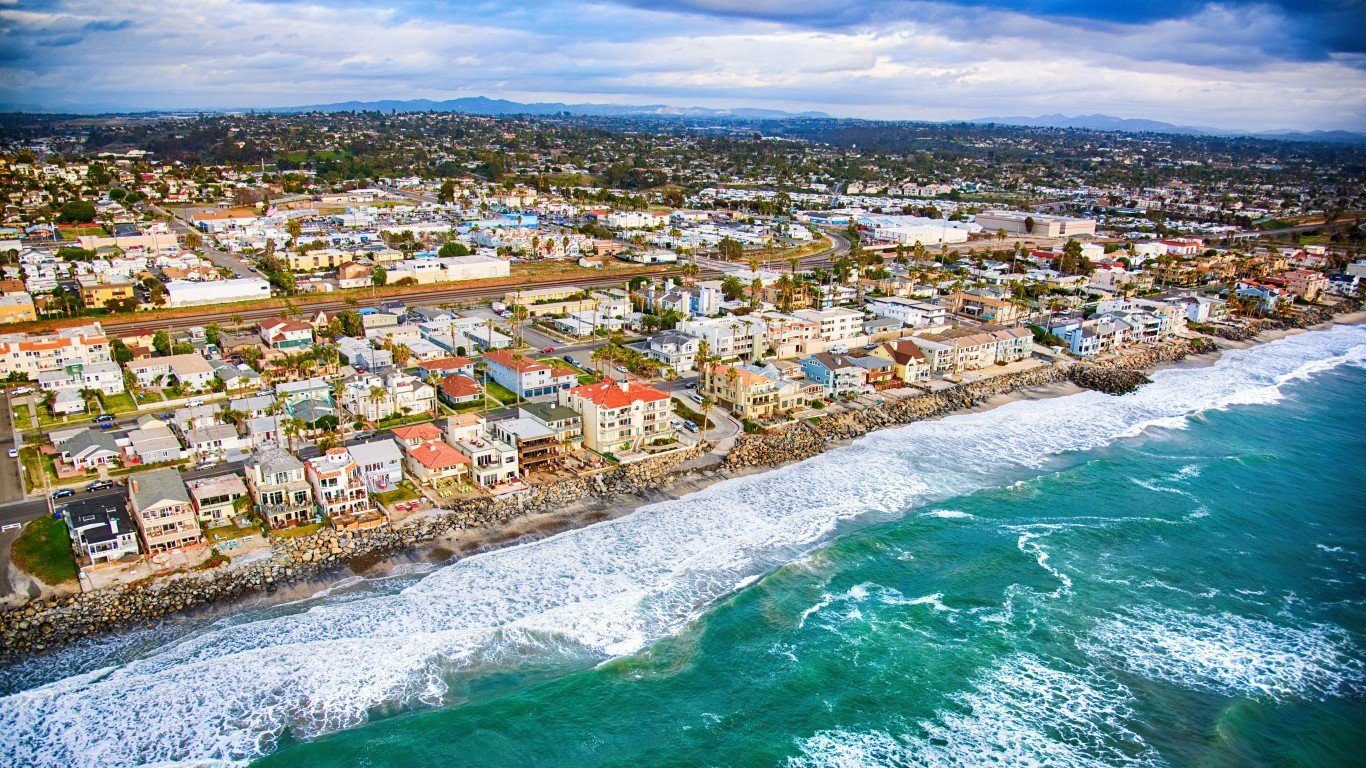
- Avg. life expectancy at birth: 81.8 years
- Poverty rate: 10.6%
- Adults with a bachelor’s degree: 41.0%
- Median household income: $96,974
- Population: 3,289,701
11. Napa County
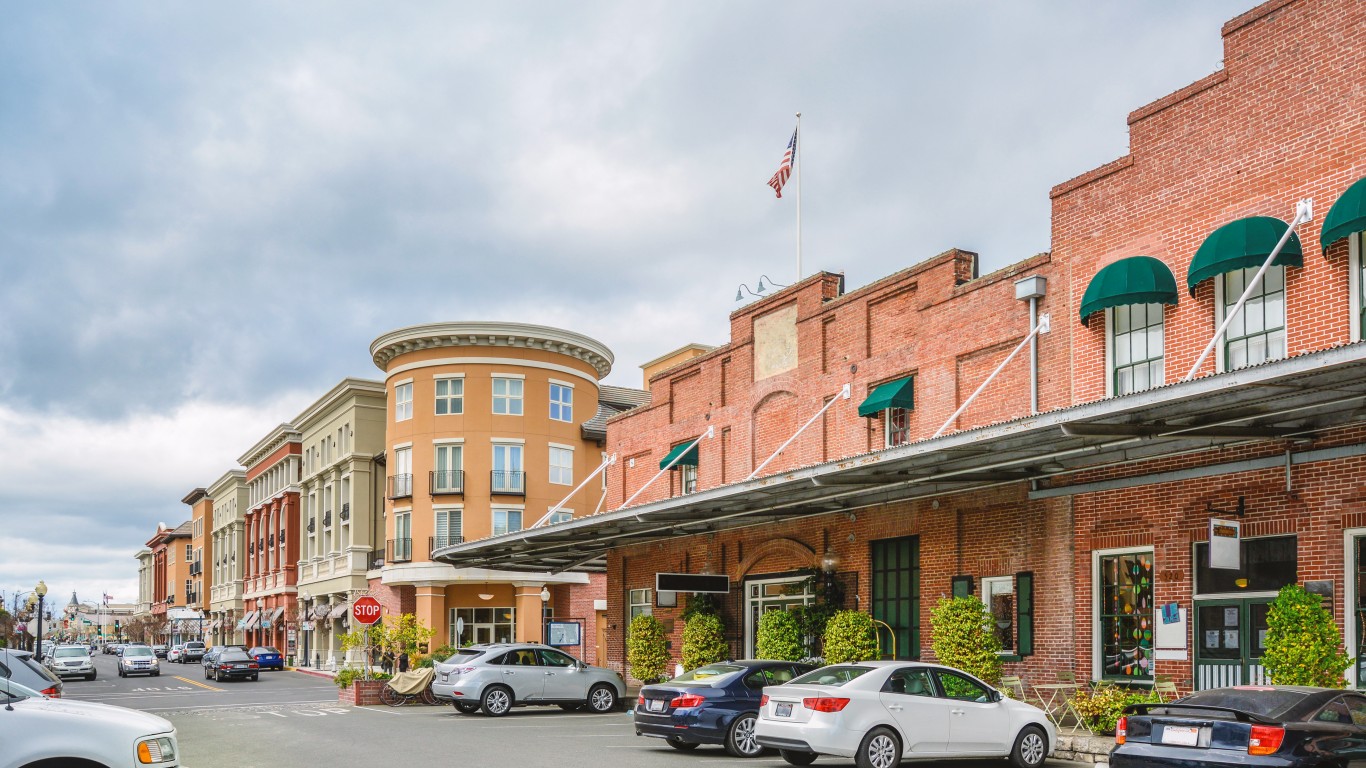
- Avg. life expectancy at birth: 82.1 years
- Poverty rate: 7.9%
- Adults with a bachelor’s degree: 37.8%
- Median household income: $105,809
- Population: 137,384
10. Santa Cruz County
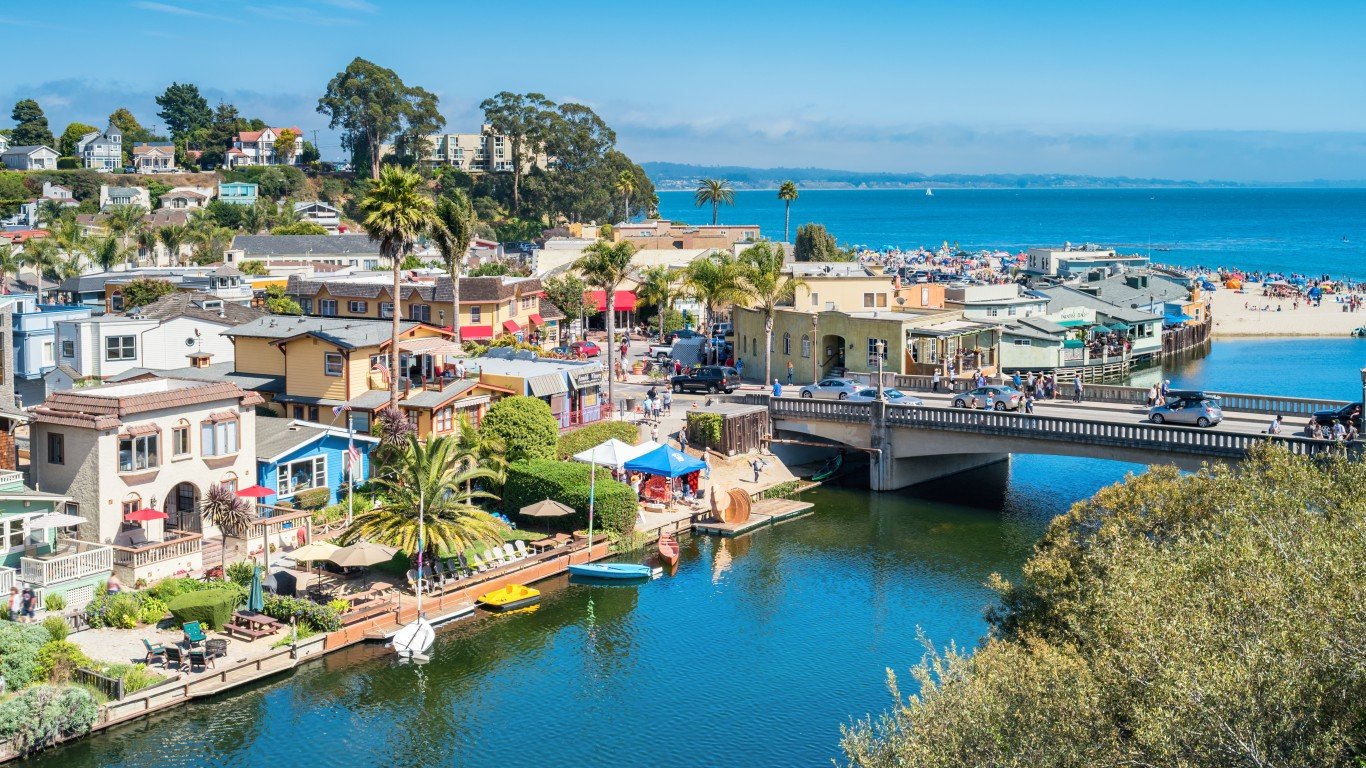
- Avg. life expectancy at birth: 82.7 years
- Poverty rate: 11.4%
- Adults with a bachelor’s degree: 42.5%
- Median household income: $104,409
- Population: 268,571
9. Orange County

- Avg. life expectancy at birth: 82.8 years
- Poverty rate: 9.7%
- Adults with a bachelor’s degree: 42.8%
- Median household income: $109,361
- Population: 3,175,227
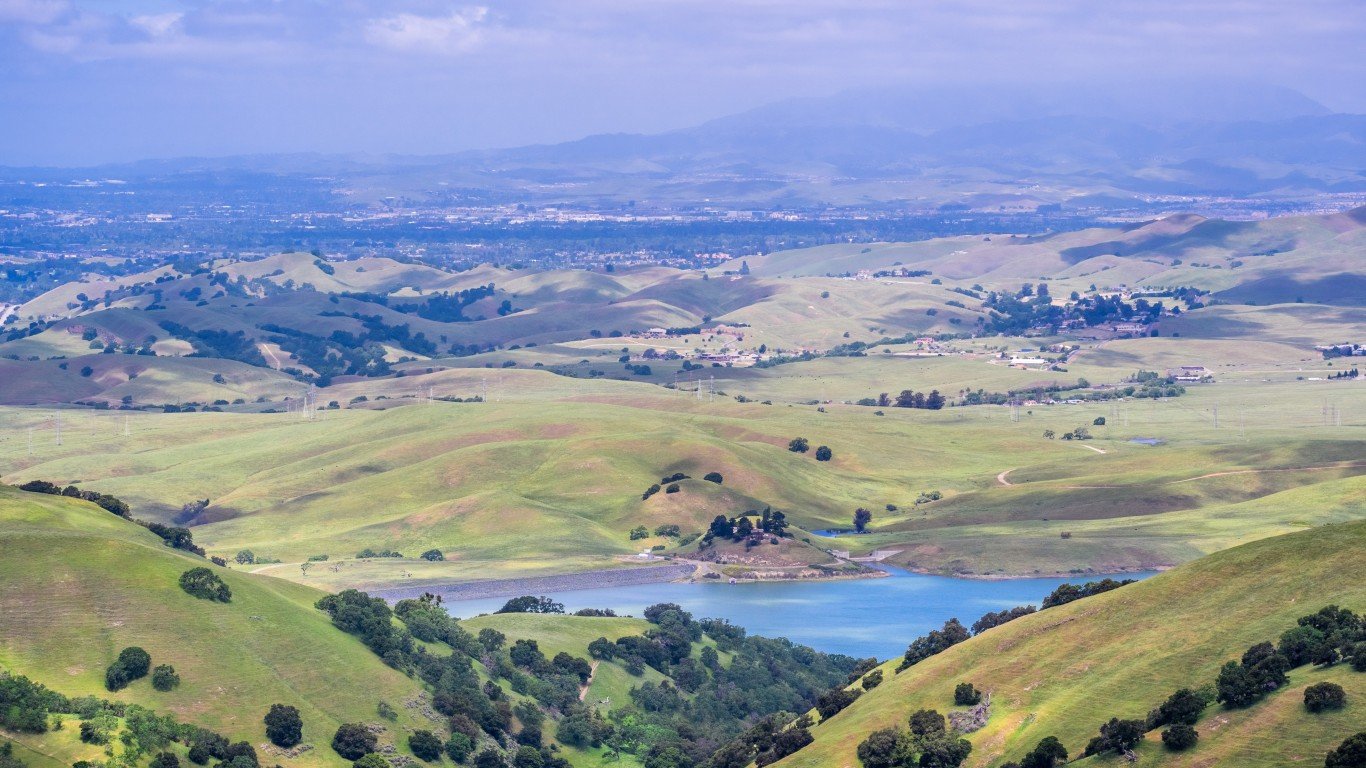
8. Contra Costa County
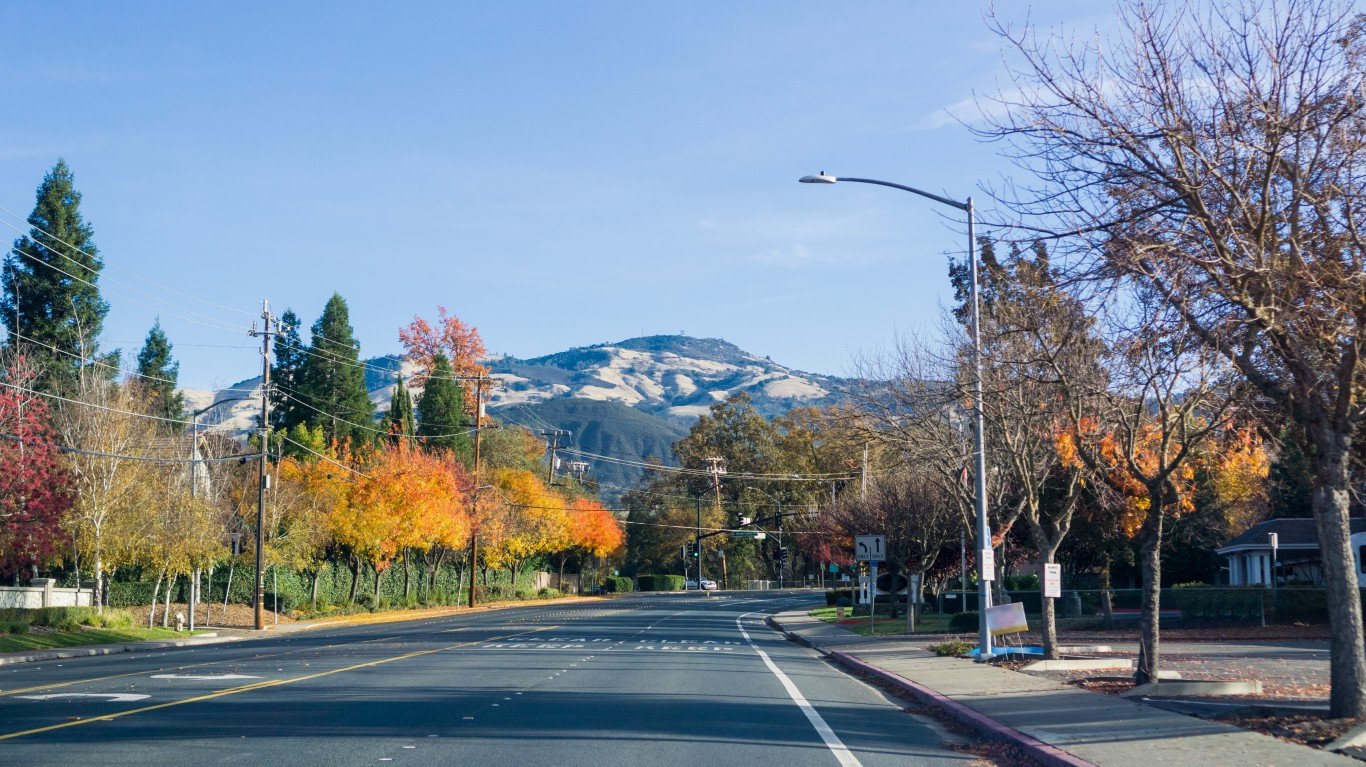
- Avg. life expectancy at birth: 82.2 years
- Poverty rate: 8.3%
- Adults with a bachelor’s degree: 44.5%
- Median household income: $120,020
- Population: 1,162,648
7. Placer County
- Avg. life expectancy at birth: 82.3 years
- Poverty rate: 6.8%
- Adults with a bachelor’s degree: 42.4%
- Median household income: $109,375
- Population: 406,608
6. Alameda County
- Avg. life expectancy at birth: 82.8 years
- Poverty rate: 9.2%
- Adults with a bachelor’s degree: 50.9%
- Median household income: $122,488
- Population: 1,663,823
5. Mono County

- Avg. life expectancy at birth: >100 years
- Poverty rate: 11.3%
- Adults with a bachelor’s degree: 31.7%
- Median household income: $82,038
- Population: 13,219
4. San Francisco County

- Avg. life expectancy at birth: 83.7 years
- Poverty rate: 10.5%
- Adults with a bachelor’s degree: 59.8%
- Median household income: $136,689
- Population: 851,036
3. San Mateo County

- Avg. life expectancy at birth: 84.9 years
- Poverty rate: 6.4%
- Adults with a bachelor’s degree: 52.9%
- Median household income: $149,907
- Population: 754,250
2. Santa Clara County

- Avg. life expectancy at birth: 84.7 years
- Poverty rate: 6.9%
- Adults with a bachelor’s degree: 55.3%
- Median household income: $153,792
- Population: 1,916,831
1. Marin County

- Avg. life expectancy at birth: 85.3 years
- Poverty rate: 7.0%
- Adults with a bachelor’s degree: 61.1%
- Median household income: $142,019
- Population: 260,485
| Rank | County | Avg. life expectancy at birth (yrs.) | Adults with a bachelor’s degree (%) | Poverty rate (%) | Population |
|---|---|---|---|---|---|
| 1 | Marin, California | 85.3 | 61.1 | 7.0 | 260,485 |
| 2 | Santa Clara, California | 84.7 | 55.3 | 6.9 | 1,916,831 |
| 3 | San Mateo, California | 84.9 | 52.9 | 6.4 | 754,250 |
| 4 | San Francisco, California | 83.7 | 59.8 | 10.5 | 851,036 |
| 5 | Mono, California | 100+ | 31.7 | 11.3 | 13,219 |
| 6 | Alameda, California | 82.8 | 50.9 | 9.2 | 1,663,823 |
| 7 | Placer, California | 82.3 | 42.4 | 6.8 | 406,608 |
| 8 | Contra Costa, California | 82.2 | 44.5 | 8.3 | 1,162,648 |
| 9 | Orange, California | 82.8 | 42.8 | 9.7 | 3,175,227 |
| 10 | Santa Cruz, California | 82.7 | 42.5 | 11.4 | 268,571 |
| 11 | Napa, California | 82.1 | 37.8 | 7.9 | 137,384 |
| 12 | San Diego, California | 81.8 | 41.0 | 10.6 | 3,289,701 |
| 13 | El Dorado, California | 81.9 | 38.0 | 8.6 | 191,713 |
| 14 | Sonoma, California | 82.0 | 37.8 | 8.9 | 488,436 |
| 15 | Nevada, California | 80.8 | 38.8 | 10.4 | 102,322 |
| 16 | Ventura, California | 82.3 | 34.7 | 9.0 | 842,009 |
| 17 | San Luis Obispo, California | 81.8 | 38.0 | 12.6 | 281,712 |
| 18 | Yolo, California | 81.5 | 43.3 | 17.4 | 217,141 |
| 19 | Santa Barbara, California | 81.8 | 35.7 | 13.5 | 445,213 |
| 20 | Los Angeles, California | 81.3 | 34.6 | 13.7 | 9,936,690 |
| 21 | Solano, California | 80.0 | 28.2 | 9.0 | 450,995 |
| 22 | San Benito, California | 81.9 | 22.0 | 7.5 | 64,753 |
| 23 | Sacramento, California | 79.2 | 32.6 | 13.1 | 1,579,211 |
| 24 | Monterey, California | 82.2 | 27.1 | 12.3 | 437,609 |
| 25 | Inyo, California | 78.7 | 29.0 | 11.9 | 18,829 |
| 26 | Amador, California | 79.8 | 20.6 | 7.8 | 40,577 |
| 27 | Riverside, California | 80.0 | 24.1 | 11.4 | 2,429,487 |
| 28 | Sierra, California | 81.0 | 23.9 | 12.6 | 2,916 |
| 29 | Mariposa, California | 80.6 | 28.9 | 16.0 | 17,130 |
| 30 | Tuolumne, California | 78.3 | 24.4 | 11.4 | 54,993 |
Want to Retire Early? Start Here (Sponsor)
Want retirement to come a few years earlier than you’d planned? Or are you ready to retire now, but want an extra set of eyes on your finances?
Now you can speak with up to 3 financial experts in your area for FREE. By simply clicking here you can begin to match with financial professionals who can help you build your plan to retire early. And the best part? The first conversation with them is free.
Click here to match with up to 3 financial pros who would be excited to help you make financial decisions.
The post California’s Best Counties to Live In appeared first on 24/7 Wall St..
Click this link for the original source of this article.
Author: Sam Stebbins
This content is courtesy of, and owned and copyrighted by, https://247wallst.com and its author. This content is made available by use of the public RSS feed offered by the host site and is used for educational purposes only. If you are the author or represent the host site and would like this content removed now and in the future, please contact USSANews.com using the email address in the Contact page found in the website menu.