By Ryan McMaken, Mises Institute
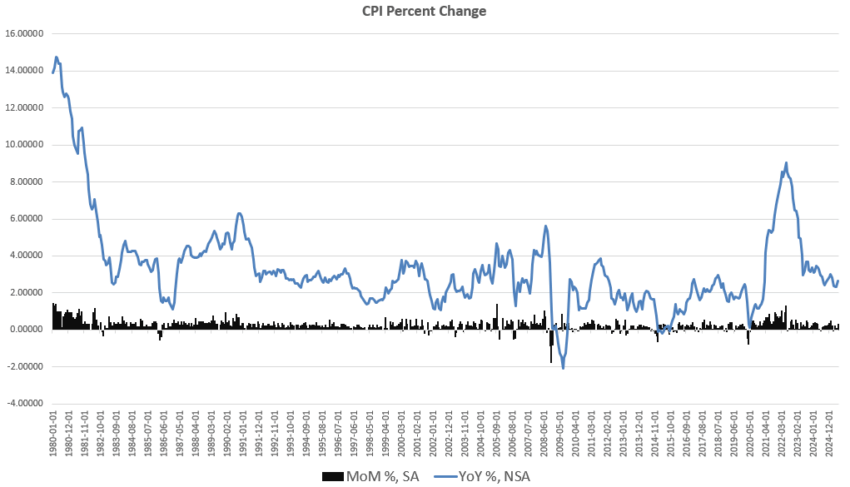
Earlier this month, we looked at June’s CPI numbers and found that, yet again, the government’s own price-inflation data shows prices continue to grow above the central bank’s two-percent inflation target. As I reported on July 15, June’s CPI growth rate was the largest year-over-year increase in four months, and the largest month-to-month increase since January 2025. June’s CPI increase also places CPI growth above of CPI growth rates experienced during September of last year. At that time, Fed Chairman Jerome Powell had declared that price inflation was rapidly moving back toward the Fed’s two-percent target. Nine months later, we can see the Fed’s forecasters were clearly wrong, as the CPI has increased by 2.1 percent in that period.

A similar trend also showed up in so-called “core CPI” which removes volatile food and energy prices. Core CPI also hit a four-month high in June, measured year-over year. Measured month-to-month, core CPI hit a five month high in June.
The Fed’s preferred measure of price-inflation, however, is the PCE (personal consumption expenditure) measure, and in a new data release Thursday morning, the BLS reports that PCE price inflation is heading upward, as well. In June, PCE increased by 0.3 percent, month over month, and that’s the largest monthly increase since February. In fact, the monthly PCE growth has gotten larger each month since February. The same is true of PCE excluding food and energy.
Looking at the PCE change, year over year, we find a similar trend. During June, PCE growth was up by 2.6 percent, year over year. That’s up from May’s growth rate of 2.4 percent, and June’s growth is the largest since February. PCE growth minus food and energy also came in at a four-month high, rising to 2.8 percent (or 2.79 percent), up from May’s measure of 2.75 percent. In spite of the Fed’s confident claims about price inflation falling to the two-percent target last fall, monthly PCE growth has changed little since April of 2024.

Of course, it is likely that the Fed never really believed that price inflation was decelerating at all. Rather, at that time, Powell and the Fed simply needed something to justify the Fed’s September cut to the policy interest rate. The Fed needed some way to explain away what was almost certainly a cynical effort to stimulate the economy for the benefit of the incumbent political party.
June’s troubling numbers on price inflation do help explain why Powell and the FOMC have been so reluctant to cut the policy interest rate yet again, in spite of repeated demands from the President. The FOMC again declined to lower the policy rate earlier this week at its July meeting. Powell is right to be concerned that a dovish turn from the Fed would fuel even more PCE inflation, and could also fuel rising yields in long-dated Treasurys.
Home Prices fall for Third Month in New Case-Shiller Survey
According to the latest Case-Shiller home price report, released on Wednesday, home prices fell for the third month in a row during May 2025, the most recent month, for which data is available.
The May report finds that the U.S. National home-price index fell 0.29 percent from April to May. That’s the third month in a row during which the index fell. The falling index reflects weakening demand for homes in a number of the cities, surveyed with twelve cities showing outright declines. These cities include Atlanta, Dallas, Denver, Las Vegas, Los Angeles, Miami, Phoenix, San Diego, San Francisco, Seattle, Tampa, and Washington, DC. Only four cities – Cleveland, Minneapolis, Charlotte, and Tampa – showed month-over month acceleration. (See here for the full report.)

Compared year over year, the U.S. National home-price rose 2.2 percent from May 2024 to May 2025, slowing for the fifth month in a row. May’s home-price growth was also the lowest since 2023 in the aftermath of the asset-price inflation fueled by covid-era stimulus. Excluding the covid period, May’s home price growth came in at the lowest since August of 2012.
As with month-to-month trends, decelerating home-price growth was fueled especially by a number of cities in the Western and Sun Belt regions. The five cities with the weakest growth rates, year over year, were Los Angeles (-0.48%), Miami (-0.12%), San Francisco, (-0.02%) and Seattle (0.03%), and Phoenix (0.06%).

According to the Case-Shiller press release:
“May’s data continued the year’s slow unwind of price momentum, with annual gains narrowing for a fourth consecutive month,” said Nicholas Godec, CFA, CAIA, CIPM, Head of Fixed Income Tradables & Commodities at S&P Dow Jones Indices. “National home prices were just 2.3% higher than a year ago, the smallest increase since July 2023, and nearly all of that gain occurred in the most recent six months. The spring market lifted prices modestly, but not enough to suggest sustained acceleration. …
“Monthly trends also signaled broad-based fatigue. All three headline indices rose just 0.4% on a non seasonally adjusted basis, the slowest monthly gain since January. … Only four cities – Cleveland, Minneapolis, Charlotte, and Tampa – showed month-over month acceleration, pointing to waning momentum breadth even as most cities still registered nominal gains.
Rising inventory in many cities-especially in Western and Sun Belt cities, continues to point toward slowdowns and declines in home price growth. Anecdotal evidence about for-sale inventory continues to suggest this trend will continue. For example, according to Realtor.com, active listings experienced a “huge leap“ in June. Year-over-year active listings were up by 77.6 percent in Las Vegas, 63.6 percent in Washington, DC, and 56.4 percent in Raleigh, NC.
A number of factors are at work here. One factor is that the average 30-year fixed mortgage rate has more than doubled since 2022, rising from 2.9 percent in July of 2021 to 6.7 during July of this year. This change has made monthly mortgage payments unaffordable to a growing portion of the market. For example, a $500,000 loan requires a monthly payment of $2,100 per month while the same loan at 6.5 percent requires a payment of $3,160 per month.
This has caused many potential buyers to think twice about buying, and inventory has consequently been rising. This trend toward hesitancy in buying has also been due to the stagnation in both the job market and in production overall. Moreover, debt in areas other than mortgages has been surging, as has delinquencies on these debts.
In the longer term, though, sellers will have to lower their asking prices if they want to sell their homes in a market with much higher mortgage rates. That will be good for potential home buyers. Home prices have only very recently begun to adjust, however, as we see in the Case-Shiller data. In some major metros, prices are still heading up.
Given how much the US regulatory state and the central bank intervene to prop up home prices, though, it is remarkable that home prices have fallen at all. It is important to keep in mind that the US federal government routinely intervenes in the mortgage markets to drive up both demand and prices. (High asset prices are good for Wall Street special interests.)
For example, the de facto federal agencies of Fannie Mae and Freddie Mac exist to increase liquidity in mortgage markets, driving up prices. Moreover, the Federal Reserve has, since 2008, bought up more than $2 trillion in mortgage backed securities, also stimulating additional investment in for-purchase housing, and higher prices. Were the Fed to sell off these assets, mortgage rates would further rise and prices would fall much more rapidly than we are now seeing.
Because of these incessant efforts to raise asset prices, home prices continue to be relatively resilient. Prices do not reflect real market supply and demand, of course, but they do, nonetheless, reflect the manufactured reality of government-stimulated asset pricing.
It is likely we will only see substantial declines in home prices as the job market continues to worsen. This can come about in two ways. Job losses could mount in the same manner as we often see in recession: people lose their jobs, and then they become motivated sellers, fueling foreclosures and falling home prices. Another possibility is that price inflation in areas other than for-purchase housing will continue to build and homeowners are forced to downsize as wages can no longer keep up with the cost of living.
After all, the most recent data on price inflation continues to show that prices are moving upward, and not back to the Fed’s two-percent price-inflation goal. Today, for example, new data from the BLS shows that PCE inflation rose 2.6 percent in June, year over year. That’s up from May’s annual increase of 2.4 percent. Goods prices, meanwhile, posted their largest gain since January.
Unfortunately, our ruling oligarchy, for more than thirty years, has decided that it prefers rising asset prices—which favor Wall Street cronies and others who already own assets—over affordability for ordinary people. This is what central bank policy and federal regulatory policy is geared toward: to ensure ever rising asset prices, even if it means middle-class wages cannot keep up.
This is also why we continue to hear increasingly frantic demands from the Trump White House demanding that the central bank lower interest rates. Unfortunately for Trump and other friends of wealthy asset owners, it is not clear that the central bank can, at this point in the cycle, bring mortgage rates down substantially. The last time the Fed forced down interest rates, the average mortgage rate actually increased. So long as ongoing worries about inflation and federal debt persist among bond investors, long term yields may remain stubbornly high.

QTR’s Disclaimer: Please read my full legal disclaimer on my About page here. This post represents my opinions only. In addition, please understand I am an idiot and often get things wrong and lose money. I may own or transact in any names mentioned in this piece at any time without warning. Contributor posts and aggregated posts have been hand selected by me, have not been fact checked and are the opinions of their authors. They are either submitted to QTR by their author, reprinted under a Creative Commons license with my best effort to uphold what the license asks, or with the permission of the author.
This is not a recommendation to buy or sell any stocks or securities, just my opinions. I often lose money on positions I trade/invest in. I may add any name mentioned in this article and sell any name mentioned in this piece at any time, without further warning. None of this is a solicitation to buy or sell securities. I may or may not own names I write about and are watching. Sometimes I’m bullish without owning things, sometimes I’m bearish and do own things. Just assume my positions could be exactly the opposite of what you think they are just in case. If I’m long I could quickly be short and vice versa. I won’t update my positions. All positions can change immediately as soon as I publish this, with or without notice and at any point I can be long, short or neutral on any position. You are on your own. Do not make decisions based on my blog. I exist on the fringe. If you see numbers and calculations of any sort, assume they are wrong and double check them. I failed Algebra in 8th grade and topped off my high school math accolades by getting a D- in remedial Calculus my senior year, before becoming an English major in college so I could bullshit my way through things easier.
The publisher does not guarantee the accuracy or completeness of the information provided in this page. These are not the opinions of any of my employers, partners, or associates. I did my best to be honest about my disclosures but can’t guarantee I am right; I write these posts after a couple beers sometimes. I edit after my posts are published because I’m impatient and lazy, so if you see a typo, check back in a half hour. Also, I just straight up get shit wrong a lot. I mention it twice because it’s that important.
Click this link for the original source of this article.
Author: Quoth the Raven
This content is courtesy of, and owned and copyrighted by, https://quoththeraven.substack.com feed and its author. This content is made available by use of the public RSS feed offered by the host site and is used for educational purposes only. If you are the author or represent the host site and would like this content removed now and in the future, please contact USSANews.com using the email address in the Contact page found in the website menu.