Home prices have surged in the U.S. in recent years. Driven by rising demand and supply constraints during the pandemic, the median home sale price spiked by nearly 50% from the second quarter of 2020 to Q3 in 2022. While the sale price of a typical American home has fallen in recent months since, housing prices remain at historic highs.
Not only have home values soared, but borrowing costs for home buyers have also climbed. The average interest rate on a 30-year fixed mortgage has been above 6% since September 2022, a high not seen in nearly a decade and a half. In a market defined by high prices and high mortgage rates, homeownership has become prohibitively expensive for a large number of Americans.
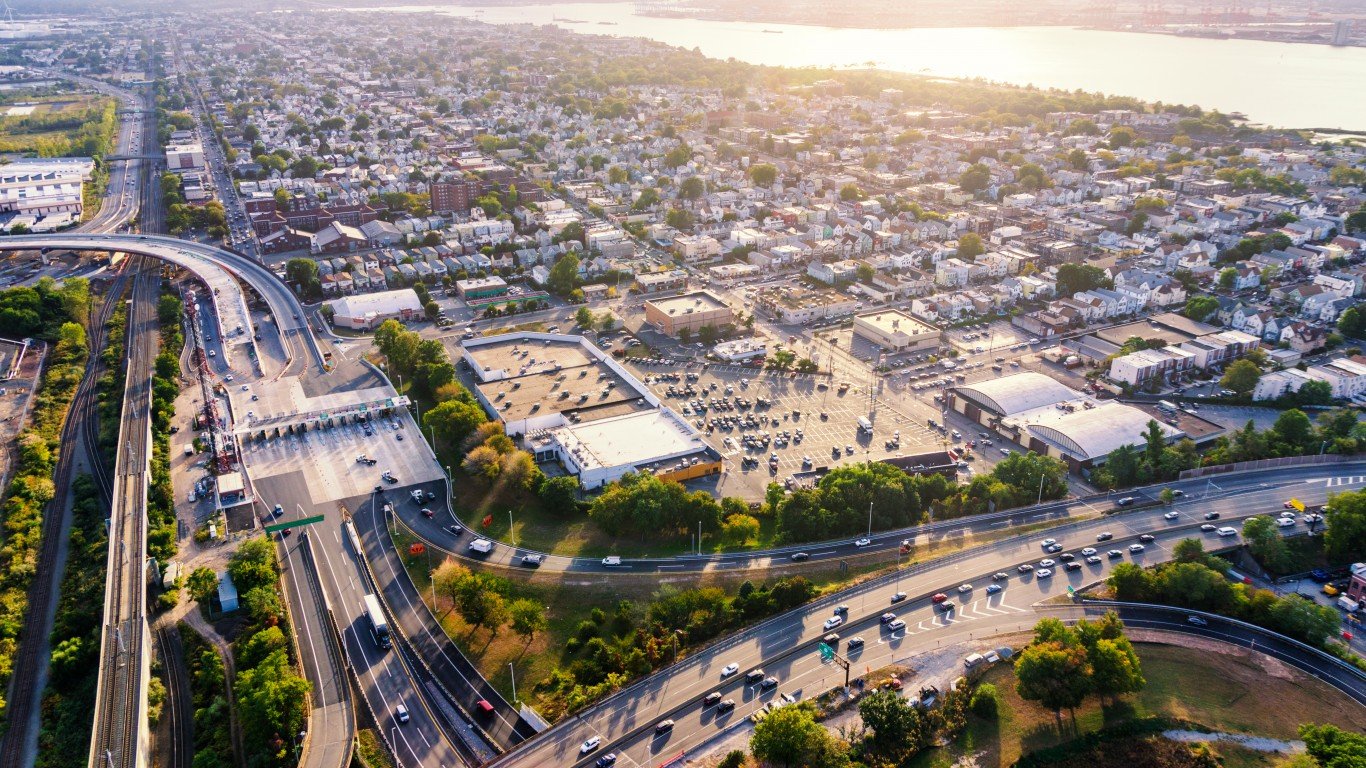
Still, housing prices are also subject to a number of factors that can be isolated from broader, nationwide market trends — and location is one of them. Two homes that are virtually identical can vary in price by hundreds of thousands of dollars, depending on where they are. And for prospective homeowners on a budget, some New Jersey cities are far more affordable than others.

According to five-year estimates from the U.S. Census Bureau’s 2022 American Community Survey, the typical home in New Jersey is worth $401,400. But across the 42 cities, towns, and unincorporated communities in the state with populations of at least 25,000, median home values range from less than $100,000 to over $970,000.
In any local market, home prices are often a reflection of what residents can afford. In New Jersey, many of the least expensive cities for homebuyers are not high-income areas. Of the 42 New Jersey cities with available data from the ACS, 22 have a median home value that is less than the statewide median. In all but two of these places, the typical household earns less than the statewide median household income of $97,126.
These are the cheapest and most expensive housing markets in New Jersey.
42. Camden
- Median home value: $95,700
- Homes worth over $1 million: 0.0%
- Homeownership rate: 37.2%
- Median household income: $36,258
- Total population: 71,799
41. Trenton

- Median home value: $111,200
- Homes worth over $1 million: 2.1%
- Homeownership rate: 38.3%
- Median household income: $44,444
- Total population: 90,055
40. Bridgeton
- Median home value: $130,800
- Homes worth over $1 million: 0.5%
- Homeownership rate: 37.7%
- Median household income: $44,440
- Total population: 26,895
39. Atlantic City

- Median home value: $174,200
- Homes worth over $1 million: 1.3%
- Homeownership rate: 30.8%
- Median household income: $35,188
- Total population: 38,487
38. Millville
- Median home value: $185,400
- Homes worth over $1 million: 1.6%
- Homeownership rate: 65.5%
- Median household income: $65,279
- Total population: 27,523
37. Vineland
- Median home value: $205,500
- Homes worth over $1 million: 0.4%
- Homeownership rate: 68.8%
- Median household income: $63,468
- Total population: 60,796
36. Sicklerville
- Median home value: $232,000
- Homes worth over $1 million: 0.8%
- Homeownership rate: 81.3%
- Median household income: $97,576
- Total population: 45,853
35. East Orange

- Median home value: $282,900
- Homes worth over $1 million: 0.6%
- Homeownership rate: 28.0%
- Median household income: $58,659
- Total population: 68,879
34. New Brunswick

- Median home value: $289,800
- Homes worth over $1 million: 1.2%
- Homeownership rate: 20.2%
- Median household income: $57,138
- Total population: 55,718
33. Newark
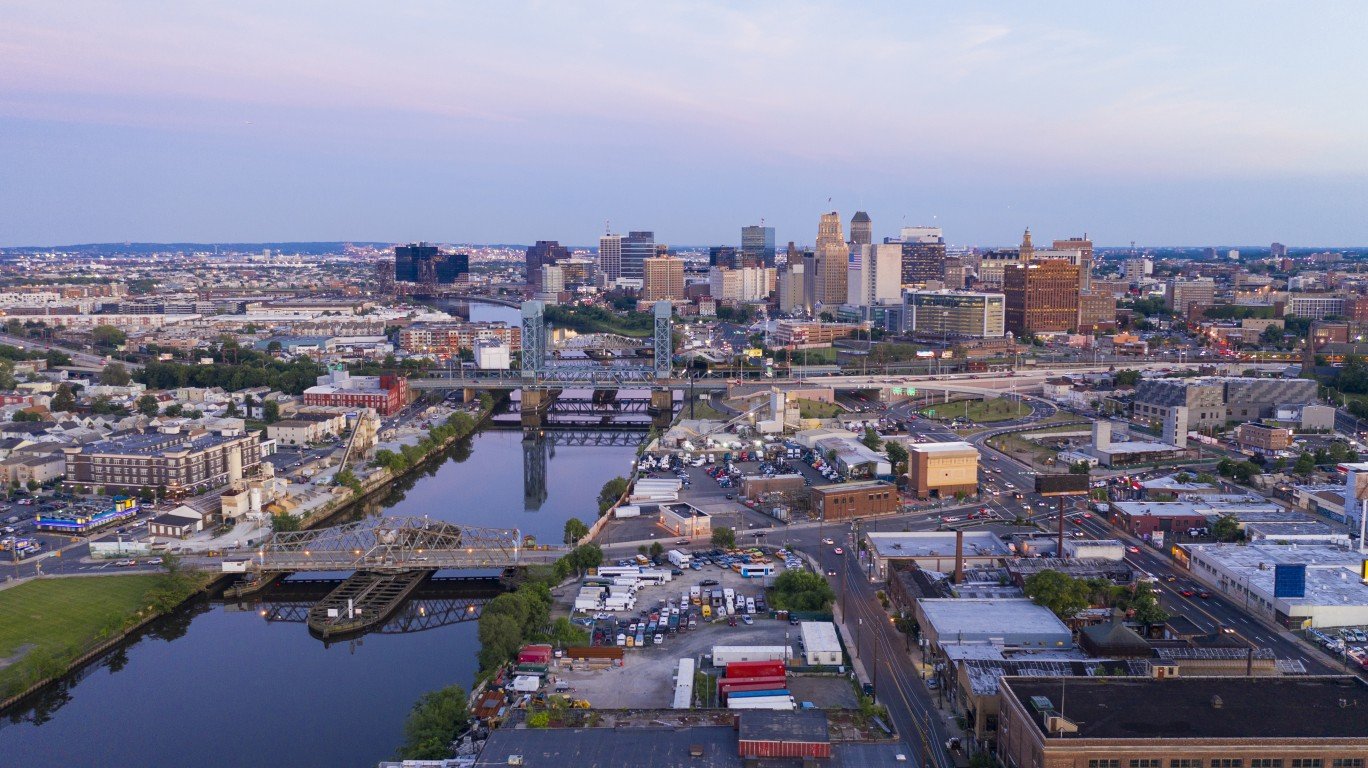
- Median home value: $312,300
- Homes worth over $1 million: 2.1%
- Homeownership rate: 23.9%
- Median household income: $46,460
- Total population: 307,355
32. Paterson
- Median home value: $314,100
- Homes worth over $1 million: 1.1%
- Homeownership rate: 26.3%
- Median household income: $52,092
- Total population: 157,864
31. Perth Amboy
- Median home value: $327,700
- Homes worth over $1 million: 0.8%
- Homeownership rate: 35.3%
- Median household income: $56,239
- Total population: 55,226
30. Carteret
- Median home value: $337,500
- Homes worth over $1 million: 0.3%
- Homeownership rate: 54.4%
- Median household income: $79,049
- Total population: 25,161
29. Rahway
- Median home value: $343,200
- Homes worth over $1 million: 1.3%
- Homeownership rate: 55.1%
- Median household income: $86,557
- Total population: 29,664
28. Plainfield
- Median home value: $351,500
- Homes worth over $1 million: 1.0%
- Homeownership rate: 44.1%
- Median household income: $70,712
- Total population: 54,358
27. Hackensack
- Median home value: $353,000
- Homes worth over $1 million: 0.7%
- Homeownership rate: 36.5%
- Median household income: $79,133
- Total population: 45,758
26. Toms River
- Median home value: $356,100
- Homes worth over $1 million: 2.1%
- Homeownership rate: 80.6%
- Median household income: $92,012
- Total population: 92,827
25. Linden
- Median home value: $357,000
- Homes worth over $1 million: 0.4%
- Homeownership rate: 60.0%
- Median household income: $86,801
- Total population: 43,478
24. Elizabeth
- Median home value: $358,400
- Homes worth over $1 million: 0.3%
- Homeownership rate: 25.1%
- Median household income: $59,939
- Total population: 135,665
23. Sayreville

- Median home value: $377,600
- Homes worth over $1 million: 0.8%
- Homeownership rate: 63.6%
- Median household income: $95,250
- Total population: 45,136
22. Passaic

- Median home value: $379,800
- Homes worth over $1 million: 2.7%
- Homeownership rate: 22.0%
- Median household income: $57,832
- Total population: 70,048
21. Fort Lee
- Median home value: $393,200
- Homes worth over $1 million: 8.4%
- Homeownership rate: 58.4%
- Median household income: $101,573
- Total population: 39,799
20. Kearny

- Median home value: $404,000
- Homes worth over $1 million: 0.8%
- Homeownership rate: 47.2%
- Median household income: $81,307
- Total population: 41,157
19. West New York

- Median home value: $407,000
- Homes worth over $1 million: 2.2%
- Homeownership rate: 23.5%
- Median household income: $70,141
- Total population: 52,438
18. Bayonne
- Median home value: $413,100
- Homes worth over $1 million: 1.3%
- Homeownership rate: 39.2%
- Median household income: $80,044
- Total population: 70,497
17. Lodi
- Median home value: $423,900
- Homes worth over $1 million: 2.3%
- Homeownership rate: 44.3%
- Median household income: $80,044
- Total population: 25,969
16. Clifton
- Median home value: $428,000
- Homes worth over $1 million: 1.3%
- Homeownership rate: 57.5%
- Median household income: $94,179
- Total population: 89,451
15. Garfield
- Median home value: $430,500
- Homes worth over $1 million: 0.6%
- Homeownership rate: 46.6%
- Median household income: $72,026
- Total population: 32,472
14. Bergenfield
- Median home value: $437,700
- Homes worth over $1 million: 2.4%
- Homeownership rate: 69.6%
- Median household income: $121,738
- Total population: 28,223
13. Old Bridge

- Median home value: $440,400
- Homes worth over $1 million: 0.1%
- Homeownership rate: 73.0%
- Median household income: $104,712
- Total population: 28,094
12. Long Branch
- Median home value: $446,800
- Homes worth over $1 million: 5.9%
- Homeownership rate: 42.6%
- Median household income: $72,234
- Total population: 31,932
11. Union City

- Median home value: $448,000
- Homes worth over $1 million: 1.5%
- Homeownership rate: 19.7%
- Median household income: $59,967
- Total population: 67,258
10. Englewood
- Median home value: $453,200
- Homes worth over $1 million: 18.0%
- Homeownership rate: 54.6%
- Median household income: $93,134
- Total population: 29,109
9. Fair Lawn
- Median home value: $488,300
- Homes worth over $1 million: 1.9%
- Homeownership rate: 79.3%
- Median household income: $141,540
- Total population: 34,948
8. Jersey City

- Median home value: $500,100
- Homes worth over $1 million: 11.3%
- Homeownership rate: 29.2%
- Median household income: $91,151
- Total population: 287,899
7. Cliffside Park
- Median home value: $520,800
- Homes worth over $1 million: 6.6%
- Homeownership rate: 48.3%
- Median household income: $96,734
- Total population: 25,546
6. Lakewood
- Median home value: $604,600
- Homes worth over $1 million: 13.9%
- Homeownership rate: 38.6%
- Median household income: $54,826
- Total population: 68,555
5. Paramus
- Median home value: $684,800
- Homes worth over $1 million: 13.9%
- Homeownership rate: 81.5%
- Median household income: $136,824
- Total population: 26,582
4. Ridgewood
- Median home value: $858,900
- Homes worth over $1 million: 32.9%
- Homeownership rate: 83.0%
- Median household income: $211,224
- Total population: 26,043
3. Hoboken
- Median home value: $859,300
- Homes worth over $1 million: 30.6%
- Homeownership rate: 34.4%
- Median household income: $168,137
- Total population: 58,754

2. Westfield
- Median home value: $890,000
- Homes worth over $1 million: 37.0%
- Homeownership rate: 79.8%
- Median household income: $203,235
- Total population: 30,839
1. Princeton
- Median home value: $971,200
- Homes worth over $1 million: 47.0%
- Homeownership rate: 58.6%
- Median household income: $176,695
- Total population: 30,450
| Rank | Places in New Jersey with at least 25,000 residents | Median home value ($) | Homeownership rate (%) | Median household income ($) | Total Population |
|---|---|---|---|---|---|
| 1 | Princeton | 971,200 | 58.6 | 176,695 | 30,450 |
| 2 | Westfield | 890,000 | 79.8 | 203,235 | 30,839 |
| 3 | Hoboken | 859,300 | 34.4 | 168,137 | 58,754 |
| 4 | Ridgewood | 858,900 | 83.0 | 211,224 | 26,043 |
| 5 | Paramus | 684,800 | 81.5 | 136,824 | 26,582 |
| 6 | Lakewood | 604,600 | 38.6 | 54,826 | 68,555 |
| 7 | Cliffside Park | 520,800 | 48.3 | 96,734 | 25,546 |
| 8 | Jersey City | 500,100 | 29.2 | 91,151 | 287,899 |
| 9 | Fair Lawn | 488,300 | 79.3 | 141,540 | 34,948 |
| 10 | Englewood | 453,200 | 54.6 | 93,134 | 29,109 |
| 11 | Union City | 448,000 | 19.7 | 59,967 | 67,258 |
| 12 | Long Branch | 446,800 | 42.6 | 72,234 | 31,932 |
| 13 | Old Bridge | 440,400 | 73.0 | 104,712 | 28,094 |
| 14 | Bergenfield | 437,700 | 69.6 | 121,738 | 28,223 |
| 15 | Garfield | 430,500 | 46.6 | 72,026 | 32,472 |
| 16 | Clifton | 428,000 | 57.5 | 94,179 | 89,451 |
| 17 | Lodi | 423,900 | 44.3 | 80,044 | 25,969 |
| 18 | Bayonne | 413,100 | 39.2 | 80,044 | 70,497 |
| 19 | West New York | 407,000 | 23.5 | 70,141 | 52,438 |
| 20 | Kearny | 404,000 | 47.2 | 81,307 | 41,157 |
| 21 | Fort Lee | 393,200 | 58.4 | 101,573 | 39,799 |
| 22 | Passaic | 379,800 | 22.0 | 57,832 | 70,048 |
| 23 | Sayreville | 377,600 | 63.6 | 95,250 | 45,136 |
| 24 | Elizabeth | 358,400 | 25.1 | 59,939 | 135,665 |
| 25 | Linden | 357,000 | 60.0 | 86,801 | 43,478 |
| 26 | Toms River | 356,100 | 80.6 | 92,012 | 92,827 |
| 27 | Hackensack | 353,000 | 36.5 | 79,133 | 45,758 |
| 28 | Plainfield | 351,500 | 44.1 | 70,712 | 54,358 |
| 29 | Rahway | 343,200 | 55.1 | 86,557 | 29,664 |
| 30 | Carteret | 337,500 | 54.4 | 79,049 | 25,161 |
| 31 | Perth Amboy | 327,700 | 35.3 | 56,239 | 55,226 |
| 32 | Paterson | 314,100 | 26.3 | 52,092 | 157,864 |
| 33 | Newark | 312,300 | 23.9 | 46,460 | 307,355 |
| 34 | New Brunswick | 289,800 | 20.2 | 57,138 | 55,718 |
| 35 | East Orange | 282,900 | 28.0 | 58,659 | 68,879 |
| 36 | Sicklerville | 232,000 | 81.3 | 97,576 | 45,853 |
| 37 | Vineland | 205,500 | 68.8 | 63,468 | 60,796 |
| 38 | Millville | 185,400 | 65.5 | 65,279 | 27,523 |
| 39 | Atlantic City | 174,200 | 30.8 | 35,188 | 38,487 |
| 40 | Bridgeton | 130,800 | 37.7 | 44,440 | 26,895 |
| 41 | Trenton | 111,200 | 38.3 | 44,444 | 90,055 |
| 42 | Camden | 95,700 | 37.2 | 36,258 | 71,799 |
Essential Tips for Investing: Sponsored
A financial advisor can help you understand the advantages and disadvantages of investment properties. Finding a qualified financial advisor doesn’t have to be hard. SmartAsset’s free tool matches you with up to three financial advisors who serve your area, and you can interview your advisor matches at no cost to decide which one is right for you. If you’re ready to find an advisor who can help you achieve your financial goals, get started now.
Investing in real estate can diversify your portfolio. But expanding your horizons may add additional costs. If you’re an investor looking to minimize expenses, consider checking out online brokerages. They often offer low investment fees, helping you maximize your profit.
The post The Cheapest and Most Expensive Housing Markets in New Jersey appeared first on 24/7 Wall St..
Click this link for the original source of this article.
Author: Sam Stebbins

This content is courtesy of, and owned and copyrighted by, https://247wallst.com and its author. This content is made available by use of the public RSS feed offered by the host site and is used for educational purposes only. If you are the author or represent the host site and would like this content removed now and in the future, please contact USSANews.com using the email address in the Contact page found in the website menu.