Executive summary
Pretty much all mainstream statisticians, data scientists, and epidemiologists ignore my work.
But not all. I recently got an email from a college professor of mathematics who decided to do a more detailed analysis to see if my recent survey was accurately reflecting reality.
His conclusion: Yes, the survey results are very convincing and we have a very serious problem. The survey results which implicate the vaccines as the primary cause of chronic disease cannot be “explained away” as “biased” or “confounded.”

This is likely why I was unable to get a qualified epidemiologist, statistician, data scientist, or mathematician to challenge me on my results in a public forum.
The whole vaccine schedule is a healthcare disaster and nobody wants to talk about it.
The survey data
Professor Switkay’s comments to me
Hello, Steve and Wayne. I have worked on Steve’s spreadsheet linked in a Substack today:


The data is at this link: https://www.skirsch.com/covid/Vaxxed_unvaxxed.xlsx
I didn’t think it was enough to compare only the highest vaxxed and lowest vaxxed cohorts, overlooking the middle of the sample and population. Instead, I regressed the log odds of adverse events against the logit vax incidence in each of the 5 vax cohorts.
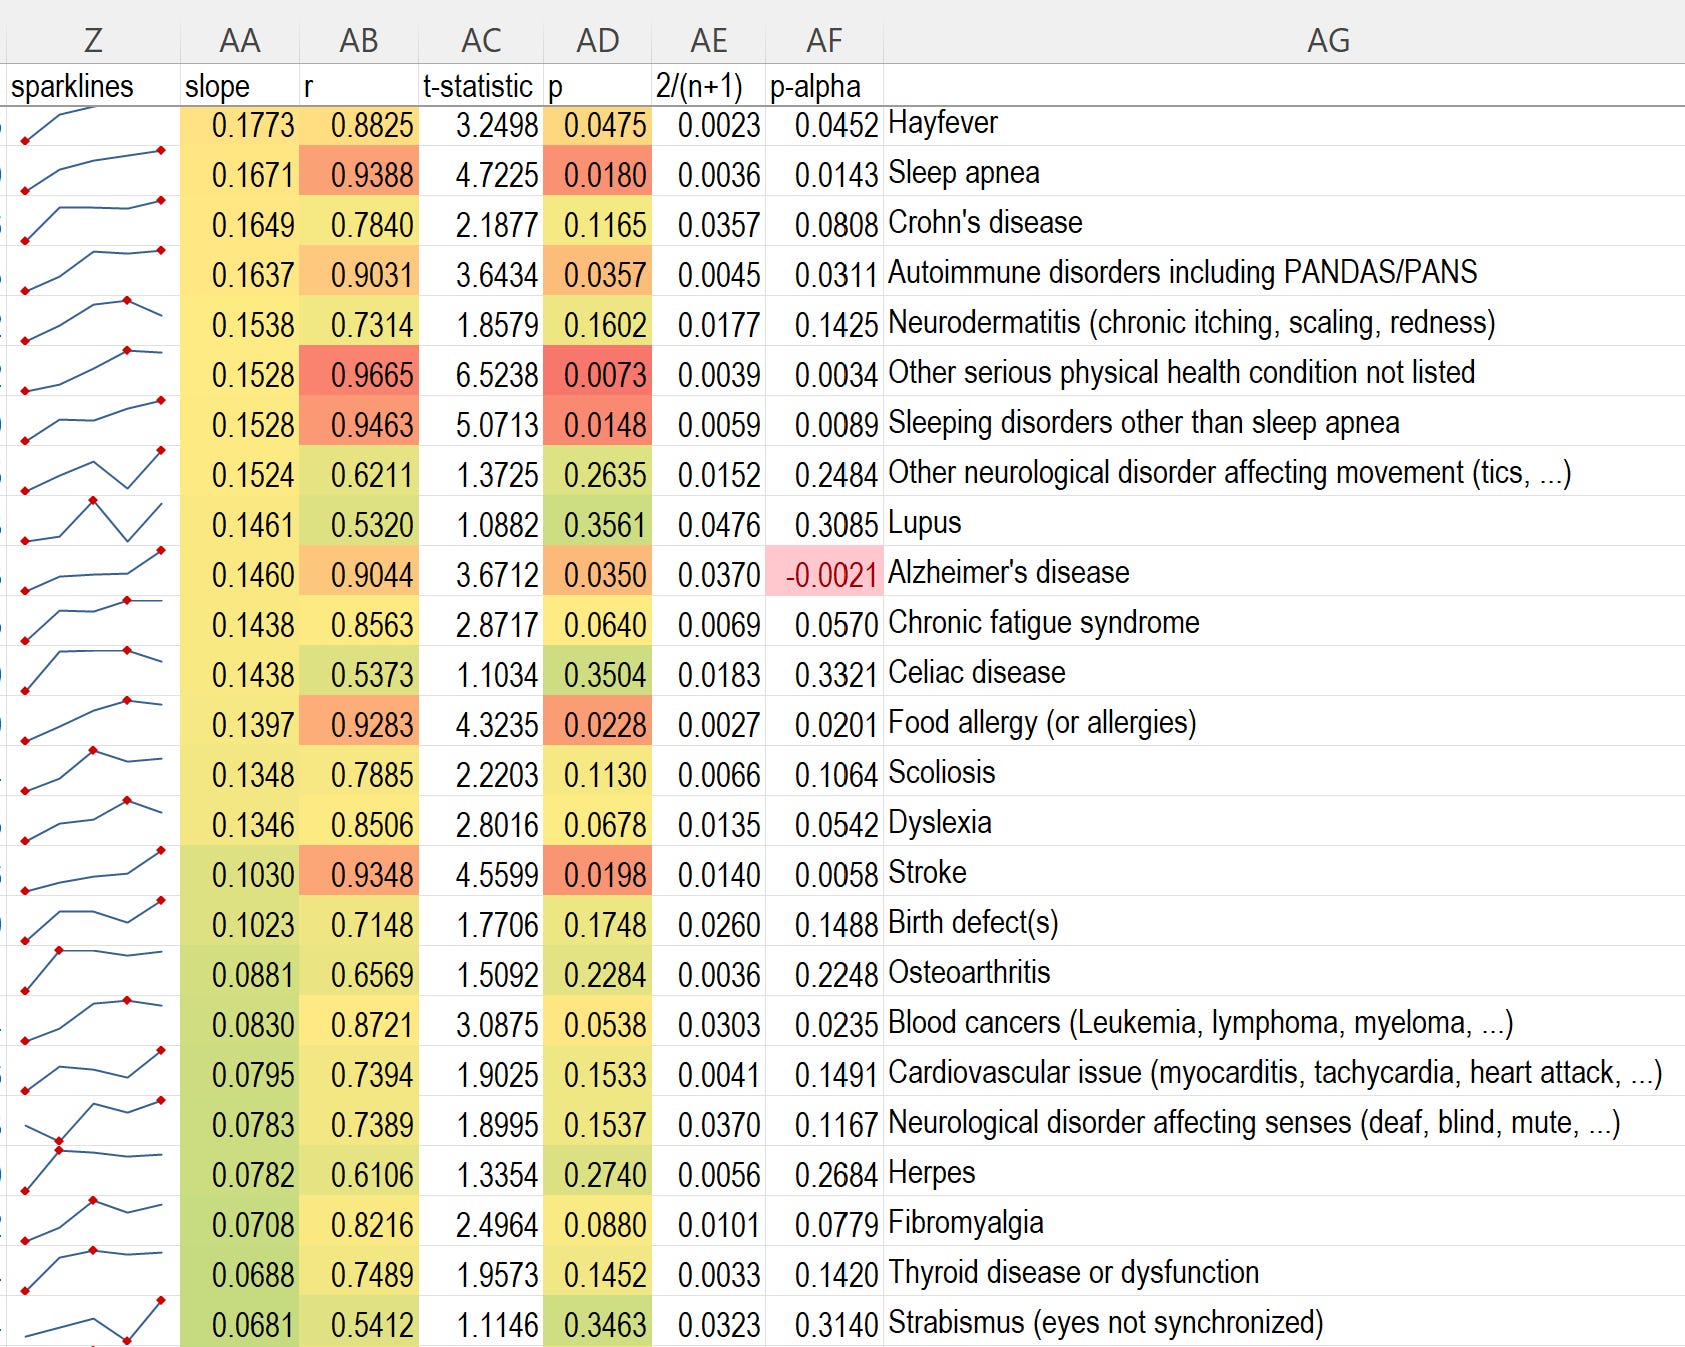
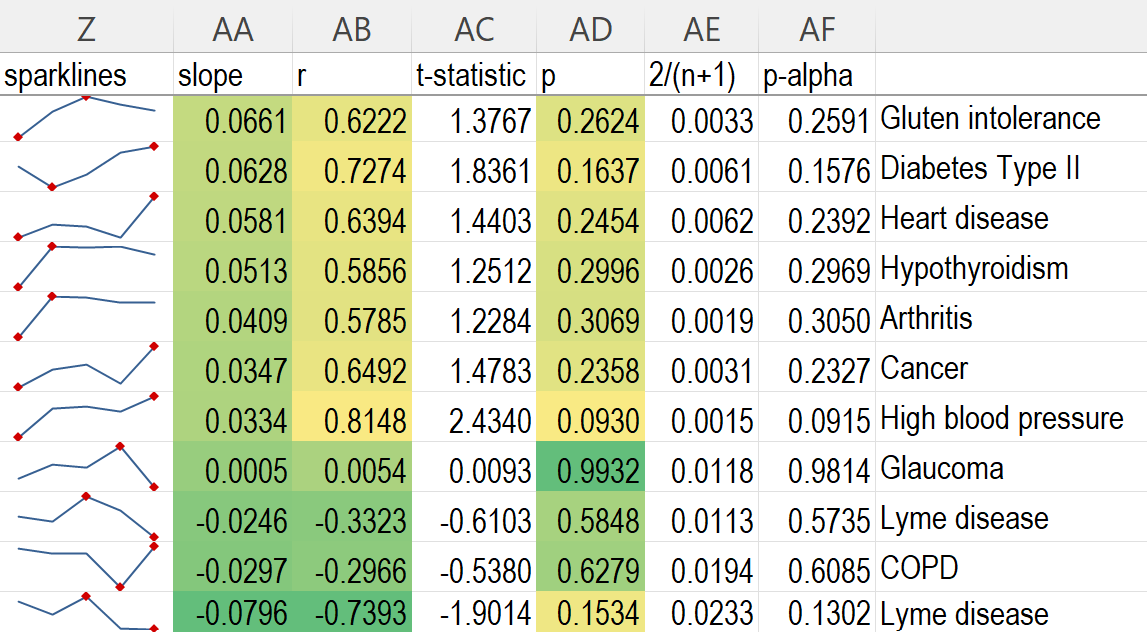
Notice that there are 3 people who claim to have COVID vax injuries while being completely unvaxxed. Instead, I call that cohort very low vaxxed: vax incidence 0-10%. Then I use the midpoints of the vax incidence bins as reference points: 0.05, 0.175, 0.5, 0.825, 0.95, and compute the logits. These are the calculations in columns T-X. Column Z shows sparklines.
Column AA computes the correlations r. Column AB is the corresponding t-statistic: r*sqrt(n-2)/sqrt(1-r^2). In our case, n = 5 (5 ordered pairs on each row, for the 5 cohorts). t is distributed with 3 degrees of freedom.

Column AC has the p-values. The lowest p-values are associated with depression; sexual orientation issues; bleeding in the brain; and bipolar disease. Three of the top four are neuro-psych issues; the other is craniovascular. I’m surprised you didn’t ask about anxiety as well.
Columns AD and AE refer to my earlier work, “The Significance of Statistical Significance”: https://www.researchgate.net/publication/348020549_The_Significance_of_Statistical_Significance
There I argue that the threshold alpha for statistical significance should not automatically be 0.05, but rather 2/(n+1), where n is the sample size. I may have miscalculated this fraction on this spreadsheet. You could argue that n = 5, since there are 5 cohorts on each row, and the regression line is based on 5 ordered pairs. If so, then most rows achieve statistical significance, because their p-values are less than 2/(5+1) = 1/3.
I would love to see the ages of the participants. As someone born in 1960, I had the basic core of early vaccines, with an annual flu shot. Now I am a professor, and my students are becoming more and more fragile each year. I had a hunch it was due to the explosion in the vaccine schedule, and you may have revealed the connection for the world to see.
Please let me know if I can help any further. All the best –
Second email
Good morning, Steve. I read your four messages, so I am replying to the most recent one.
Thanks for setting the record straight; you did indeed include tons of other data that I did not study in my initial reply.
Nothing in your analysis strikes me as incorrect.
Having said that, I suspect that a reviewer looking at your analysis would say that the results were “loaded” by comparing only the extreme groups (very low vaxxed and very high vaxxed), and that it is theoretically possible that the middle group had the lowest adverse event rate of all. This is why I personally preferred to analyze all the groups using regression analysis. Quantitative is more informative than qualitative; regression is more informative than dichotomous.
I have shared other data with my students: the data set used in my paper here – https://pdmj.org/papers/Comment_on_Subramanian_and_Kumar
Or see here: https://www.researchgate.net/profile/Hal-Switkay-2 My h-index is 1 (LOL).
Subramanian and Kumar are professors of public health. They published a paper using international data showing that COVID jab rates are, disappointingly, not negatively correlated with COVID new case rates. I took one look at the graph and gasped. Not negatively correlated? They are highly positively correlated!!! I wrote to Subramanian about this; he never replied. I did a quick correlation analysis based on second-term statistics, and sent it in as a letter to the editor of their journal, affiliated with Springer. They wrote back within 24 hours, the fastest turnaround ever in my experience. They stated that not only would they not publish my letter; NO Springer journal would publish my letter! Rejection, sight unseen!
I sent this to Dr. Colleen Huber, who agreed to publish this in the journal she founded, PDMJ. Just as she wrote “Neither Safe nor Effective”, my published work proved the jabs have negative efficacy, so I worked as well on the safety angle. I created some graphics illustrating the dangers of the COVID jabs. Please see the attached pdf, most of which I wrote. The graphics are all mine. I posted the graphic on page 9 outside my office door, showing that the COVID jabs are responsible for about 30 times as many dangerous adverse events as all vaccines combined. This includes “serious” (death, life threatening, permanent disability, birth defect, hospitalization), together with selected non-serious adverse events like myocarditis, heart attack, stroke, cancer, and neurological disease.
My attachment also explains why I use the more conservative under-reporting factor of 17, because of the comparison between VAERS and V-SAFE, an estimate I would like to publish. Thus I estimate 600K+ COVID jab deaths.
My home phone number is xxxxxxxx. I know you’re in CA. I’m in southeastern PA, so maybe I will ring you up after our lunch here. All the best to you and Wayne, and thanks for listening! Take care – Hal
My survey shouldn’t be a surprise to anyone who is familiar with these resources
-
This post:

This post:

Brian Hooker’s book Vaxxed-Unvaccinated.
Summary
Yeah, my survey was accurate. Yeah, the results are devastating even if just ONE of the effects is true.
I’ve tried to get people who believe in vaccines to survey their followers and they all stop talking to me after I ask. Every single one.
Do you know anyone with a large follower base (100K or more) who is willing to encourage their followers to fill out my survey? If so, please let me know!
There is no doubt in my mind the results can be replicated, but nobody wants to try for some reason.