The core insight of the 16th Theorem of Government is that you don’t need perfect policy for economic growth.
There will be some progress so long as private sector isn’t being completely smothered by bad policy.
That being said, I’ve spent my entire professional life trying to explain to policy makers that they should limit the size and scope of government so that the private sector has plenty of “breathing room” to deliver rapid growth.

- Some jurisdictions do a good job of getting that kind of growth over the long run. Singapore is a good example, as was Hong Kong before the Chinese crackdown.
- Some nations do a lousy job, however, with statist policies that suffocate the economy. North Korea is an extreme example, and Argentina (pre-Milei) is another tragic case.
The United States is basically between those two extremes. And America’s economic performance is the focus of today’s column.
I want to build on what I wrote in 2021 and 2024 to sort of celebrate that Americans are getting richer (I will only “sort of” celebrate because – with better policy – we could be getting richer at a significantly faster rate).
And I’m not even going to provide any of my own analysis. Instead, I’m going to share various charts showing how living standards have improved over the past few decades.

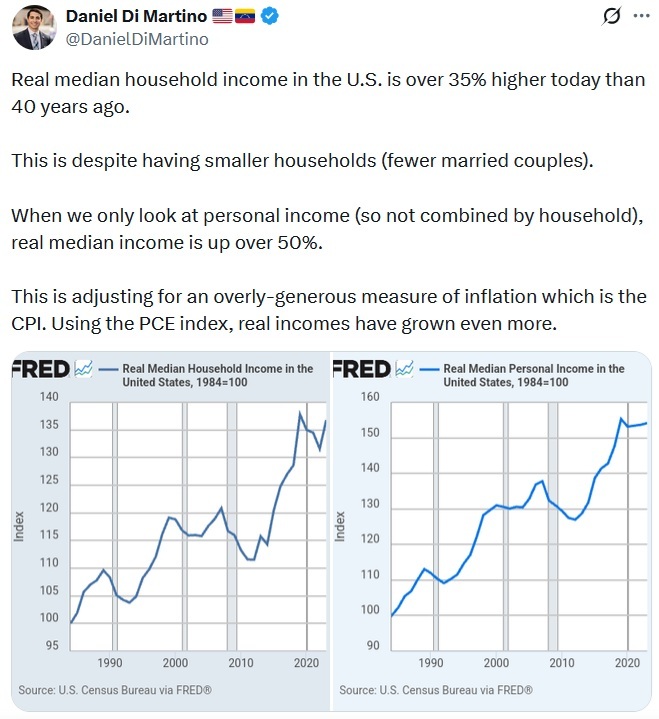
We’ll start with a couple of charts from Daniel Di Martino.
Our second chart is from Mark Perry. It shows that more and more people over time enjoy higher living standards.

Next we have a chart prepared by Jeremy Horpedahl.

Here are some similarly encouraging trend lines from John Lettieri.

By the way, some folks on the left (and even some on the right) want to dismiss the above evidence by admitting there have been economic gains, but then asserting that ordinary people have not enjoyed any of the benefits.

So let’s look at a few more charts showing how all income groups have benefited. We’ll start with this chart from Mark Perry.

Next we have a chart from a report by Scott Lincicome.

And here’s a chart shared by Gary Winslett.

Next we have a chart from an article by James Pethokoukis.

Last but not least, here’s a chart from the Wall Street Journal showing impressive mobility between generations.

I’ll close by noting that these charts should not be interpreted to suggest America can or should rest on its laurels.
There is much that could be done to get faster growth for everyone (free trade, tax reform, deregulation, etc) as well as steps that should be taken that would be especially beneficial to the less fortunate (school choice, welfare reform, etc).
Click this link for the original source of this article.
Author: Dan Mitchell
This content is courtesy of, and owned and copyrighted by, https://freedomandprosperity.org and its author. This content is made available by use of the public RSS feed offered by the host site and is used for educational purposes only. If you are the author or represent the host site and would like this content removed now and in the future, please contact USSANews.com using the email address in the Contact page found in the website menu.